|
Download Data (XLS File) |
|
||||||||
|
||||||||
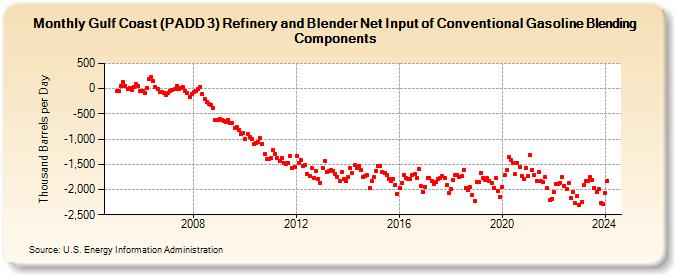
| Gulf Coast (PADD 3) Refinery and Blender Net Input of Conventional Gasoline Blending Components (Thousand Barrels per Day) | ||||||||
| Year | Jan | Feb | Mar | Apr | May | Jun | Jul | Aug | Sep | Oct | Nov | Dec |
|---|---|---|---|---|---|---|---|---|---|---|---|---|
| 2005 | -53 | -53 | 49 | 136 | 52 | 2 | 23 | -18 | 38 | 102 | 52 | -41 |
| 2006 | -40 | -76 | 19 | 196 | 230 | 160 | 36 | -2 | -59 | -67 | -81 | -121 |
| 2007 | -77 | -40 | -31 | -10 | 57 | 1 | 17 | 28 | -42 | -90 | -156 | -104 |
| 2008 | -67 | -53 | -15 | 39 | -106 | -197 | -265 | -307 | -328 | -389 | -614 | -631 |
| 2009 | -597 | -623 | -647 | -664 | -614 | -678 | -676 | -782 | -758 | -814 | -902 | -871 |
| 2010 | -1,003 | -893 | -966 | -1,007 | -1,088 | -1,083 | -1,059 | -988 | -1,097 | -1,291 | -1,387 | -1,389 |
| 2011 | -1,380 | -1,215 | -1,287 | -1,376 | -1,429 | -1,368 | -1,467 | -1,500 | -1,472 | -1,339 | -1,580 | -1,552 |
| 2012 | -1,327 | -1,480 | -1,415 | -1,526 | -1,508 | -1,691 | -1,730 | -1,578 | -1,774 | -1,639 | -1,790 | -1,868 |
| 2013 | -1,564 | -1,429 | -1,651 | -1,635 | -1,611 | -1,624 | -1,684 | -1,744 | -1,836 | -1,653 | -1,797 | -1,838 |
| 2014 | -1,753 | -1,574 | -1,681 | -1,520 | -1,564 | -1,535 | -1,620 | -1,749 | -1,739 | -1,714 | -1,963 | -1,832 |
| 2015 | -1,747 | -1,633 | -1,527 | -1,538 | -1,655 | -1,682 | -1,710 | -1,799 | -1,823 | -1,789 | -1,909 | -2,093 |
| 2016 | -1,971 | -1,864 | -1,703 | -1,762 | -1,790 | -1,795 | -1,706 | -1,700 | -1,766 | -1,599 | -1,939 | -2,058 |
| 2017 | -1,944 | -1,767 | -1,769 | -1,832 | -1,884 | -1,853 | -1,801 | -1,771 | -1,738 | -1,770 | -1,905 | -2,069 |
| 2018 | -1,996 | -1,818 | -1,709 | -1,708 | -1,755 | -1,741 | -1,607 | -1,976 | -2,003 | -1,951 | -2,100 | -2,221 |
| 2019 | -1,843 | -1,856 | -1,672 | -1,766 | -1,812 | -1,781 | -1,822 | -1,872 | -1,974 | -1,774 | -2,020 | -2,144 |
| 2020 | -1,954 | -1,715 | -1,620 | -1,358 | -1,405 | -1,475 | -1,698 | -1,465 | -1,550 | -1,724 | -1,797 | -1,565 |
| 2021 | -1,739 | -1,307 | -1,612 | -1,704 | -1,828 | -1,657 | -1,835 | -1,854 | -1,747 | -1,978 | -2,199 | -2,183 |
| 2022 | -2,047 | -1,898 | -1,895 | -1,865 | -1,749 | -1,922 | -1,983 | -1,876 | -2,166 | -2,055 | -2,275 | -2,133 |
| 2023 | -2,315 | -2,246 | -1,919 | -1,828 | -1,837 | -1,759 | -1,816 | -1,964 | -2,049 | -1,995 | -2,267 | -2,281 |
| 2024 | -2,071 | |||||||||||
| - = No Data Reported; -- = Not Applicable; NA = Not Available; W = Withheld to avoid disclosure of individual company data. |
| Release Date: 3/29/2024 |
| Next Release Date: 4/30/2024 |