|
Download Data (XLS File) |
|
||||||||
|
||||||||
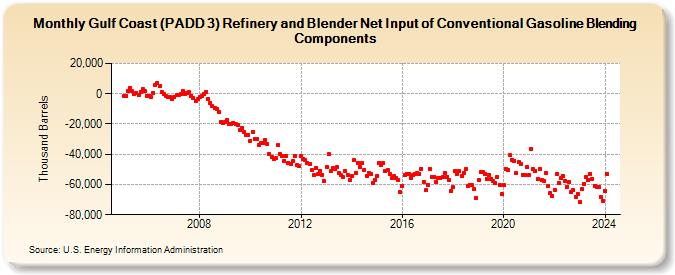
| Gulf Coast (PADD 3) Refinery and Blender Net Input of Conventional Gasoline Blending Components (Thousand Barrels) | ||||||||
| Year | Jan | Feb | Mar | Apr | May | Jun | Jul | Aug | Sep | Oct | Nov | Dec |
|---|---|---|---|---|---|---|---|---|---|---|---|---|
| 2005 | -1,654 | -1,491 | 1,528 | 4,093 | 1,609 | 70 | 707 | -552 | 1,150 | 3,174 | 1,569 | -1,270 |
| 2006 | -1,248 | -2,133 | 581 | 5,867 | 7,115 | 4,807 | 1,107 | -73 | -1,782 | -2,091 | -2,441 | -3,756 |
| 2007 | -2,392 | -1,106 | -963 | -292 | 1,781 | 39 | 525 | 880 | -1,266 | -2,775 | -4,677 | -3,239 |
| 2008 | -2,075 | -1,551 | -459 | 1,181 | -3,283 | -5,906 | -8,207 | -9,512 | -9,828 | -12,073 | -18,432 | -19,556 |
| 2009 | -18,510 | -17,445 | -20,055 | -19,928 | -19,028 | -20,342 | -20,955 | -24,243 | -22,733 | -25,221 | -27,070 | -27,007 |
| 2010 | -31,093 | -24,992 | -29,931 | -30,198 | -33,734 | -32,481 | -32,834 | -30,618 | -32,919 | -40,016 | -41,612 | -43,064 |
| 2011 | -42,769 | -34,019 | -39,897 | -41,268 | -44,309 | -41,053 | -45,489 | -46,509 | -44,172 | -41,502 | -47,398 | -48,114 |
| 2012 | -41,137 | -42,919 | -43,868 | -45,788 | -46,733 | -50,716 | -53,623 | -48,923 | -53,218 | -50,817 | -53,685 | -57,914 |
| 2013 | -48,481 | -40,024 | -51,194 | -49,036 | -49,944 | -48,731 | -52,189 | -54,061 | -55,077 | -51,234 | -53,898 | -56,992 |
| 2014 | -54,335 | -44,075 | -52,120 | -45,589 | -48,492 | -46,037 | -50,215 | -54,231 | -52,170 | -53,126 | -58,884 | -56,802 |
| 2015 | -54,143 | -45,727 | -47,345 | -46,129 | -51,314 | -50,453 | -53,022 | -55,761 | -54,693 | -55,457 | -57,273 | -64,891 |
| 2016 | -61,101 | -54,050 | -52,795 | -52,859 | -55,504 | -53,841 | -52,890 | -52,706 | -52,973 | -49,577 | -58,177 | -63,809 |
| 2017 | -60,249 | -49,478 | -54,847 | -54,964 | -58,412 | -55,584 | -55,839 | -54,916 | -52,130 | -54,883 | -57,139 | -64,153 |
| 2018 | -61,874 | -50,890 | -52,994 | -51,226 | -54,390 | -52,226 | -49,832 | -61,265 | -60,080 | -60,494 | -63,008 | -68,860 |
| 2019 | -57,138 | -51,954 | -51,843 | -52,970 | -56,164 | -53,436 | -56,468 | -58,034 | -59,218 | -55,002 | -60,589 | -66,458 |
| 2020 | -60,566 | -49,729 | -50,230 | -40,745 | -43,546 | -44,240 | -52,641 | -45,427 | -46,489 | -53,454 | -53,916 | -48,529 |
| 2021 | -53,917 | -36,609 | -49,980 | -51,110 | -56,679 | -49,723 | -56,886 | -57,479 | -52,398 | -61,329 | -65,969 | -67,677 |
| 2022 | -63,468 | -53,149 | -58,742 | -55,951 | -54,224 | -57,672 | -61,468 | -58,144 | -64,989 | -63,718 | -68,238 | -66,112 |
| 2023 | -71,768 | -62,890 | -59,500 | -54,838 | -56,956 | -52,777 | -56,309 | -60,883 | -61,482 | -61,836 | -67,998 | -70,708 |
| 2024 | -64,186 | |||||||||||
| - = No Data Reported; -- = Not Applicable; NA = Not Available; W = Withheld to avoid disclosure of individual company data. |
| Release Date: 3/29/2024 |
| Next Release Date: 4/30/2024 |