|
Download Data (XLS File) |
|
||||||||
|
||||||||
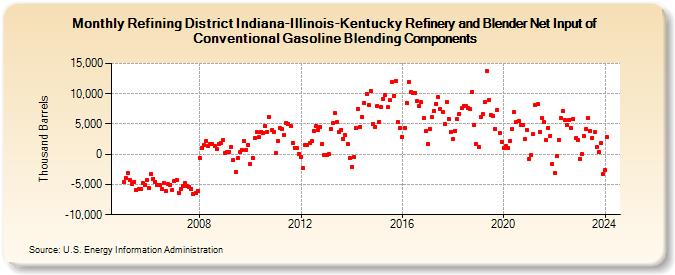
| Refining District Indiana-Illinois-Kentucky Refinery and Blender Net Input of Conventional Gasoline Blending Components (Thousand Barrels) | ||||||||
| Year | Jan | Feb | Mar | Apr | May | Jun | Jul | Aug | Sep | Oct | Nov | Dec |
|---|---|---|---|---|---|---|---|---|---|---|---|---|
| 2005 | -4,643 | -3,978 | -3,085 | -4,202 | -4,896 | -4,515 | -5,960 | -5,773 | -5,690 | -4,829 | -5,071 | -4,225 |
| 2006 | -5,622 | -3,231 | -4,016 | -4,551 | -5,032 | -5,022 | -5,698 | -4,731 | -6,053 | -5,002 | -5,047 | -5,853 |
| 2007 | -4,357 | -4,290 | -6,359 | -5,685 | -5,192 | -4,711 | -5,304 | -5,398 | -5,686 | -6,577 | -6,431 | -6,075 |
| 2008 | -637 | 1,055 | 1,460 | 2,166 | 1,430 | 1,690 | 1,725 | 1,282 | 827 | 1,732 | 1,864 | 2,391 |
| 2009 | 237 | 365 | 408 | 1,244 | -989 | -2,877 | -681 | 286 | 691 | 2,118 | 705 | 1,571 |
| 2010 | -1,548 | -682 | 2,672 | 3,637 | 2,788 | 3,683 | 3,546 | 4,646 | 3,739 | 6,187 | 4,036 | 3,727 |
| 2011 | 129 | 2,196 | 4,272 | 4,188 | 3,259 | 5,166 | 5,062 | 4,642 | 1,920 | 1,047 | 1,020 | 113 |
| 2012 | -409 | -2,312 | 1,541 | 1,590 | 1,812 | 2,152 | 3,902 | 4,651 | 3,980 | 4,425 | 1,748 | -199 |
| 2013 | -177 | 15 | 4,200 | 5,118 | 6,783 | 5,343 | 3,671 | 4,086 | 2,551 | 3,129 | 1,696 | -628 |
| 2014 | -2,183 | -418 | 4,345 | 7,477 | 4,558 | 6,192 | 8,410 | 9,977 | 8,192 | 10,531 | 5,042 | 4,511 |
| 2015 | 8,005 | 5,396 | 7,807 | 9,172 | 9,809 | 7,763 | 8,904 | 11,999 | 9,671 | 12,130 | 5,306 | 4,398 |
| 2016 | 2,822 | 4,406 | 8,436 | 11,952 | 10,325 | 10,174 | 10,197 | 8,792 | 8,021 | 8,594 | 5,960 | 3,879 |
| 2017 | 1,690 | 4,210 | 6,084 | 7,211 | 8,312 | 9,410 | 7,557 | 7,030 | 4,923 | 8,672 | 5,859 | 3,735 |
| 2018 | 2,589 | 3,898 | 5,749 | 6,714 | 7,568 | 8,040 | 7,960 | 7,647 | 7,395 | 10,356 | 4,858 | 1,687 |
| 2019 | 1,205 | 6,117 | 6,634 | 8,606 | 13,838 | 8,974 | 6,538 | 6,371 | 4,234 | 7,286 | 3,452 | 2,036 |
| 2020 | 1,090 | 1,380 | 1,075 | 2,145 | 4,112 | 6,946 | 5,299 | 5,563 | 4,889 | 4,881 | 2,512 | 4,015 |
| 2021 | -750 | -98 | 3,294 | 8,209 | 8,239 | 3,640 | 6,005 | 5,299 | 2,371 | 4,417 | 3,092 | -1,621 |
| 2022 | -3,138 | -304 | 2,408 | 5,983 | 7,183 | 5,585 | 4,767 | 5,726 | 4,282 | 5,798 | 2,613 | 2,322 |
| 2023 | -825 | 12 | 2,992 | 4,205 | 6,023 | 3,805 | 2,726 | 3,619 | 1,172 | 349 | 1,848 | -3,339 |
| 2024 | -2,641 | 2,807 | ||||||||||
| - = No Data Reported; -- = Not Applicable; NA = Not Available; W = Withheld to avoid disclosure of individual company data. |
| Release Date: 4/30/2024 |
| Next Release Date: 5/31/2024 |