|
Download Data (XLS File) |
|
||||||||
|
||||||||
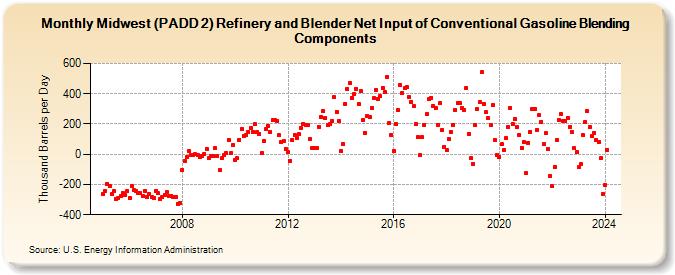
| Midwest (PADD 2) Refinery and Blender Net Input of Conventional Gasoline Blending Components (Thousand Barrels per Day) | ||||||||
| Year | Jan | Feb | Mar | Apr | May | Jun | Jul | Aug | Sep | Oct | Nov | Dec |
|---|---|---|---|---|---|---|---|---|---|---|---|---|
| 2005 | -264 | -246 | -197 | -211 | -266 | -246 | -296 | -287 | -275 | -255 | -272 | -244 |
| 2006 | -289 | -211 | -238 | -242 | -256 | -258 | -277 | -244 | -284 | -262 | -285 | -288 |
| 2007 | -242 | -259 | -298 | -280 | -268 | -251 | -277 | -274 | -285 | -282 | -327 | -322 |
| 2008 | -102 | -42 | -19 | 18 | -2 | -2 | -1 | -6 | -21 | -9 | 3 | 35 |
| 2009 | -22 | -13 | -12 | 39 | -14 | -106 | -27 | -8 | 7 | 95 | 5 | 60 |
| 2010 | -41 | -28 | 96 | 167 | 123 | 125 | 146 | 175 | 147 | 197 | 148 | 134 |
| 2011 | 6 | 87 | 167 | 189 | 146 | 227 | 226 | 220 | 125 | 84 | 89 | 34 |
| 2012 | 14 | -44 | 97 | 124 | 106 | 132 | 172 | 203 | 193 | 196 | 102 | 38 |
| 2013 | 43 | 38 | 182 | 247 | 284 | 239 | 193 | 198 | 219 | 376 | 282 | 220 |
| 2014 | 22 | 68 | 334 | 432 | 474 | 374 | 395 | 434 | 333 | 419 | 229 | 143 |
| 2015 | 255 | 243 | 305 | 369 | 425 | 368 | 383 | 441 | 409 | 511 | 208 | 127 |
| 2016 | 22 | 202 | 290 | 459 | 405 | 435 | 442 | 380 | 347 | 316 | 201 | 111 |
| 2017 | -7 | 111 | 196 | 264 | 362 | 375 | 320 | 304 | 196 | 338 | 163 | 49 |
| 2018 | 27 | 99 | 148 | 195 | 295 | 340 | 337 | 305 | 294 | 438 | 135 | -27 |
| 2019 | -63 | 194 | 298 | 343 | 541 | 334 | 276 | 239 | 191 | 324 | 92 | -2 |
| 2020 | -18 | 65 | 31 | 104 | 179 | 306 | 200 | 233 | 177 | 128 | 44 | 78 |
| 2021 | -126 | 77 | 149 | 301 | 298 | 161 | 259 | 215 | 65 | 138 | 34 | -142 |
| 2022 | -212 | -83 | 94 | 228 | 264 | 220 | 222 | 240 | 182 | 146 | 39 | 13 |
| 2023 | -86 | -67 | 125 | 214 | 283 | 182 | 118 | 143 | 96 | 80 | -27 | -261 |
| 2024 | -203 | 28 | -21 | 160 | 176 | 121 | ||||||
| - = No Data Reported; -- = Not Applicable; NA = Not Available; W = Withheld to avoid disclosure of individual company data. |
| Release Date: 8/30/2024 |
| Next Release Date: 9/30/2024 |