|
Download Data (XLS File) |
|
||||||||
|
||||||||
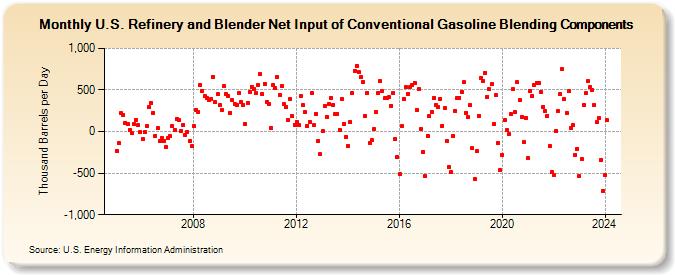
| U.S. Refinery and Blender Net Input of Conventional Gasoline Blending Components (Thousand Barrels per Day) | ||||||||
| Year | Jan | Feb | Mar | Apr | May | Jun | Jul | Aug | Sep | Oct | Nov | Dec |
|---|---|---|---|---|---|---|---|---|---|---|---|---|
| 2005 | -233 | -142 | 220 | 205 | 106 | 90 | 17 | -21 | 93 | 136 | 74 | -11 |
| 2006 | -95 | -6 | 61 | 299 | 344 | 229 | -48 | 41 | -119 | -77 | -112 | -183 |
| 2007 | -74 | -58 | 70 | 21 | 151 | 137 | 11 | 81 | -36 | 0 | -113 | -176 |
| 2008 | 64 | 257 | 239 | 561 | 489 | 424 | 400 | 377 | 392 | 661 | 350 | 447 |
| 2009 | 316 | 265 | 542 | 452 | 425 | 227 | 375 | 330 | 318 | 467 | 352 | 325 |
| 2010 | 96 | 339 | 475 | 539 | 507 | 458 | 558 | 687 | 451 | 572 | 360 | 337 |
| 2011 | 46 | 559 | 519 | 658 | 445 | 546 | 330 | 291 | 144 | 394 | 189 | 82 |
| 2012 | 120 | 75 | 423 | 314 | 233 | 65 | 117 | 467 | 74 | 209 | -115 | -275 |
| 2013 | 1 | 309 | 180 | 333 | 409 | 325 | 217 | 213 | 22 | 396 | 95 | -60 |
| 2014 | -170 | 114 | 469 | 730 | 789 | 713 | 654 | 592 | 185 | 468 | -135 | -105 |
| 2015 | 26 | 235 | 466 | 603 | 482 | 400 | 402 | 411 | 311 | 459 | -89 | -303 |
| 2016 | -515 | 63 | 392 | 532 | 456 | 538 | 554 | 589 | 262 | 508 | 27 | -240 |
| 2017 | -540 | -52 | 185 | 233 | 404 | 322 | 293 | 393 | 71 | 283 | -119 | -426 |
| 2018 | -491 | -57 | 251 | 408 | 407 | 476 | 590 | 224 | 171 | 319 | -203 | -570 |
| 2019 | -237 | 190 | 642 | 610 | 709 | 421 | 506 | 568 | 92 | 438 | -137 | -467 |
| 2020 | -277 | 138 | 15 | -35 | 208 | 507 | 230 | 590 | 375 | 179 | -129 | 168 |
| 2021 | -323 | 489 | 428 | 565 | 587 | 580 | 478 | 296 | 247 | 191 | -172 | -488 |
| 2022 | -522 | 9 | 243 | 457 | 749 | 391 | 229 | 485 | 42 | 73 | -277 | -206 |
| 2023 | -537 | -330 | 322 | 465 | 604 | 532 | 497 | 318 | 110 | 160 | -337 | -713 |
| 2024 | -517 | |||||||||||
| - = No Data Reported; -- = Not Applicable; NA = Not Available; W = Withheld to avoid disclosure of individual company data. |
| Release Date: 3/29/2024 |
| Next Release Date: 4/30/2024 |