|
Download Data (XLS File) |
|
||||||||
|
||||||||
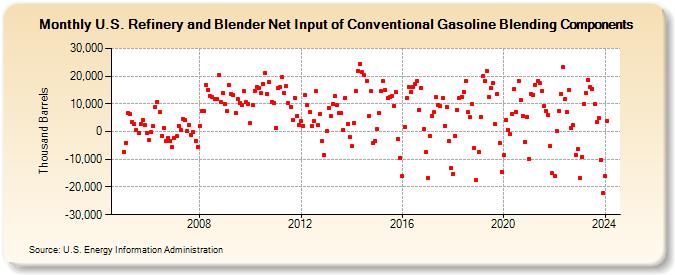
| U.S. Refinery and Blender Net Input of Conventional Gasoline Blending Components (Thousand Barrels) | ||||||||
| Year | Jan | Feb | Mar | Apr | May | Jun | Jul | Aug | Sep | Oct | Nov | Dec |
|---|---|---|---|---|---|---|---|---|---|---|---|---|
| 2005 | -7,216 | -3,987 | 6,815 | 6,154 | 3,301 | 2,691 | 514 | -655 | 2,782 | 4,210 | 2,231 | -350 |
| 2006 | -2,959 | -166 | 1,906 | 8,967 | 10,674 | 6,880 | -1,481 | 1,275 | -3,582 | -2,392 | -3,352 | -5,660 |
| 2007 | -2,299 | -1,620 | 2,172 | 625 | 4,678 | 4,098 | 326 | 2,507 | -1,080 | 6 | -3,393 | -5,469 |
| 2008 | 1,982 | 7,459 | 7,396 | 16,826 | 15,151 | 12,717 | 12,412 | 11,687 | 11,763 | 20,478 | 10,494 | 13,860 |
| 2009 | 9,782 | 7,413 | 16,798 | 13,555 | 13,164 | 6,813 | 11,620 | 10,233 | 9,553 | 14,477 | 10,546 | 10,088 |
| 2010 | 2,973 | 9,494 | 14,733 | 16,169 | 15,702 | 13,730 | 17,313 | 21,288 | 13,544 | 17,737 | 10,804 | 10,434 |
| 2011 | 1,423 | 15,655 | 16,080 | 19,743 | 13,787 | 16,388 | 10,228 | 9,022 | 4,322 | 12,227 | 5,662 | 2,540 |
| 2012 | 3,707 | 2,168 | 13,113 | 9,412 | 7,221 | 1,962 | 3,629 | 14,478 | 2,221 | 6,480 | -3,452 | -8,526 |
| 2013 | 36 | 8,643 | 5,570 | 9,980 | 12,671 | 9,747 | 6,723 | 6,604 | 655 | 12,274 | 2,837 | -1,852 |
| 2014 | -5,284 | 3,194 | 14,553 | 21,907 | 24,465 | 21,381 | 20,270 | 18,364 | 5,536 | 14,503 | -4,061 | -3,251 |
| 2015 | 820 | 6,588 | 14,455 | 18,103 | 14,953 | 11,990 | 12,477 | 12,736 | 9,329 | 14,233 | -2,665 | -9,383 |
| 2016 | -15,964 | 1,813 | 12,150 | 15,948 | 14,150 | 16,146 | 17,164 | 18,249 | 7,861 | 15,752 | 814 | -7,429 |
| 2017 | -16,739 | -1,456 | 5,729 | 6,977 | 12,530 | 9,673 | 9,070 | 12,184 | 2,125 | 8,768 | -3,570 | -13,215 |
| 2018 | -15,207 | -1,590 | 7,785 | 12,227 | 12,609 | 14,273 | 18,284 | 6,954 | 5,141 | 9,881 | -6,104 | -17,655 |
| 2019 | -7,339 | 5,330 | 19,890 | 18,302 | 21,968 | 12,643 | 15,681 | 17,611 | 2,751 | 13,581 | -4,121 | -14,469 |
| 2020 | -8,587 | 4,004 | 468 | -1,063 | 6,462 | 15,195 | 7,132 | 18,284 | 11,252 | 5,552 | -3,858 | 5,196 |
| 2021 | -10,026 | 13,698 | 13,253 | 16,948 | 18,191 | 17,401 | 14,803 | 9,173 | 7,422 | 5,913 | -5,162 | -15,117 |
| 2022 | -16,197 | 251 | 7,520 | 13,716 | 23,229 | 11,716 | 7,087 | 15,045 | 1,245 | 2,260 | -8,322 | -6,396 |
| 2023 | -16,658 | -9,231 | 9,983 | 13,945 | 18,730 | 15,958 | 15,405 | 9,871 | 3,306 | 4,947 | -10,120 | -22,096 |
| 2024 | -16,018 | |||||||||||
| - = No Data Reported; -- = Not Applicable; NA = Not Available; W = Withheld to avoid disclosure of individual company data. |
| Release Date: 3/29/2024 |
| Next Release Date: 4/30/2024 |