|
Download Data (XLS File) |
|
||||||||
|
||||||||
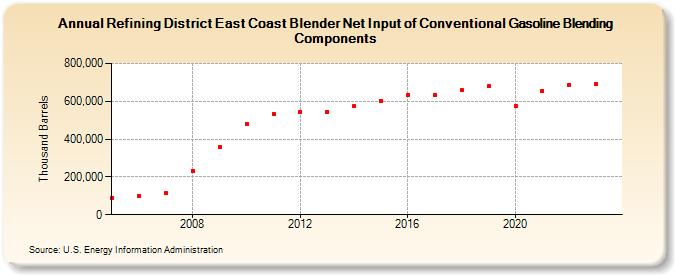
| Refining District East Coast Blender Net Input of Conventional Gasoline Blending Components (Thousand Barrels) | ||||||||
| Decade | Year-0 | Year-1 | Year-2 | Year-3 | Year-4 | Year-5 | Year-6 | Year-7 | Year-8 | Year-9 |
|---|---|---|---|---|---|---|---|---|---|---|
| 2000's | 89,442 | 99,753 | 114,016 | 233,117 | 360,363 | |||||
| 2010's | 480,565 | 534,348 | 544,799 | 545,356 | 574,901 | 602,476 | 633,239 | 633,027 | 661,928 | 679,136 |
| 2020's | 577,220 | 657,000 | 686,445 | 694,080 |
| - = No Data Reported; -- = Not Applicable; NA = Not Available; W = Withheld to avoid disclosure of individual company data. |
| Release Date: 3/29/2024 |
| Next Release Date: 8/30/2024 |