|
Download Data (XLS File) |
|
||||||||
|
||||||||
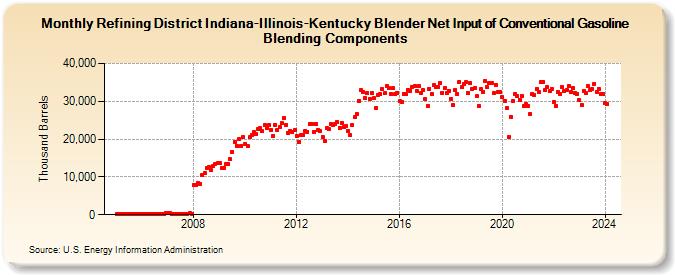
| Refining District Indiana-Illinois-Kentucky Blender Net Input of Conventional Gasoline Blending Components (Thousand Barrels) | ||||||||
| Year | Jan | Feb | Mar | Apr | May | Jun | Jul | Aug | Sep | Oct | Nov | Dec |
|---|---|---|---|---|---|---|---|---|---|---|---|---|
| 2005 | 163 | 154 | 164 | 143 | 152 | 184 | 180 | 196 | 161 | 154 | 166 | 197 |
| 2006 | 171 | 148 | 201 | 192 | 216 | 201 | 254 | 211 | 213 | 219 | 196 | 522 |
| 2007 | 472 | 360 | 300 | 227 | 223 | 274 | 290 | 313 | 288 | 287 | 349 | 302 |
| 2008 | 7,985 | 7,988 | 8,431 | 8,234 | 10,416 | 10,915 | 12,381 | 12,606 | 11,740 | 13,004 | 13,465 | 13,595 |
| 2009 | 13,641 | 12,345 | 12,375 | 13,328 | 13,483 | 14,617 | 16,694 | 19,137 | 18,251 | 19,975 | 18,232 | 20,543 |
| 2010 | 18,671 | 18,132 | 20,429 | 21,003 | 21,815 | 21,262 | 22,709 | 22,852 | 22,012 | 23,646 | 22,950 | 23,700 |
| 2011 | 22,489 | 20,886 | 23,809 | 22,495 | 23,163 | 24,159 | 25,541 | 23,801 | 21,626 | 22,096 | 21,756 | 22,329 |
| 2012 | 20,948 | 19,253 | 21,079 | 21,158 | 22,273 | 21,995 | 23,890 | 24,067 | 21,964 | 24,039 | 22,474 | 22,036 |
| 2013 | 20,626 | 19,500 | 22,879 | 22,687 | 23,989 | 23,691 | 24,099 | 24,543 | 23,064 | 24,357 | 23,115 | 23,333 |
| 2014 | 22,224 | 21,059 | 23,768 | 25,785 | 26,617 | 30,166 | 32,876 | 32,410 | 30,743 | 32,183 | 30,706 | 32,317 |
| 2015 | 30,858 | 28,179 | 31,738 | 31,855 | 33,267 | 32,076 | 33,981 | 33,413 | 31,902 | 33,422 | 31,814 | 32,310 |
| 2016 | 30,121 | 29,759 | 31,959 | 31,941 | 33,024 | 32,839 | 33,875 | 33,997 | 32,762 | 33,925 | 32,188 | 32,859 |
| 2017 | 30,548 | 28,708 | 33,326 | 32,052 | 34,238 | 33,742 | 33,835 | 34,822 | 32,194 | 33,480 | 32,324 | 32,850 |
| 2018 | 30,694 | 29,045 | 33,037 | 31,989 | 35,204 | 33,750 | 34,551 | 35,007 | 32,241 | 34,750 | 33,133 | 33,390 |
| 2019 | 31,273 | 28,797 | 33,171 | 32,585 | 35,382 | 33,653 | 34,738 | 34,922 | 32,079 | 34,404 | 32,419 | 32,472 |
| 2020 | 31,110 | 30,082 | 28,240 | 20,608 | 25,893 | 29,967 | 31,913 | 31,307 | 30,437 | 31,495 | 28,744 | 29,351 |
| 2021 | 28,789 | 26,689 | 31,971 | 31,702 | 33,338 | 32,420 | 35,028 | 35,169 | 32,905 | 33,773 | 32,634 | 33,210 |
| 2022 | 29,825 | 28,844 | 32,495 | 32,001 | 33,799 | 32,846 | 32,936 | 33,915 | 32,489 | 33,578 | 32,202 | 31,950 |
| 2023 | 30,329 | 29,078 | 32,656 | 32,163 | 34,102 | 33,015 | 33,369 | 34,685 | 32,508 | 33,378 | 31,927 | 31,993 |
| 2024 | 29,573 | 29,160 | ||||||||||
| - = No Data Reported; -- = Not Applicable; NA = Not Available; W = Withheld to avoid disclosure of individual company data. |
| Release Date: 4/30/2024 |
| Next Release Date: 5/31/2024 |