|
Download Data (XLS File) |
|
||||||||
|
||||||||
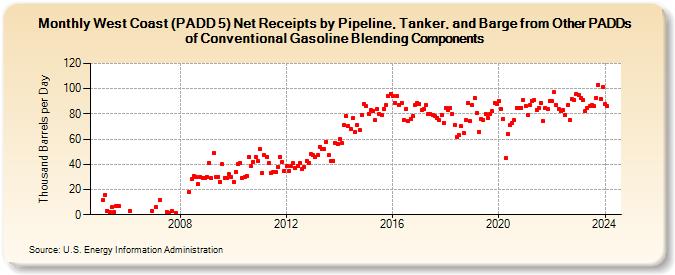
| West Coast (PADD 5) Net Receipts by Pipeline, Tanker, and Barge from Other PADDs of Conventional Gasoline Blending Components (Thousand Barrels per Day) | ||||||||
| Year | Jan | Feb | Mar | Apr | May | Jun | Jul | Aug | Sep | Oct | Nov | Dec |
|---|---|---|---|---|---|---|---|---|---|---|---|---|
| 2005 | 12 | 16 | 3 | 2 | 6 | 2 | 7 | 7 | ||||
| 2006 | 3 | 3 | ||||||||||
| 2007 | 6 | 12 | 2 | 1 | 3 | 1 | ||||||
| 2008 | 18 | 28 | 31 | 30 | 24 | 30 | 29 | 29 | ||||
| 2009 | 30 | 41 | 29 | 49 | 30 | 30 | 26 | 40 | 29 | 29 | 32 | 30 |
| 2010 | 26 | 34 | 40 | 41 | 29 | 30 | 31 | 46 | 39 | 42 | 46 | 43 |
| 2011 | 52 | 33 | 47 | 46 | 41 | 33 | 34 | 34 | 38 | 46 | 42 | 35 |
| 2012 | 39 | 35 | 39 | 41 | 37 | 39 | 41 | 36 | 38 | 43 | 41 | 48 |
| 2013 | 47 | 46 | 47 | 54 | 52 | 52 | 58 | 47 | 43 | 43 | 57 | 56 |
| 2014 | 60 | 57 | 71 | 78 | 70 | 68 | 77 | 66 | 71 | 67 | 79 | 88 |
| 2015 | 86 | 80 | 83 | 82 | 75 | 84 | 80 | 79 | 84 | 87 | 94 | 96 |
| 2016 | 94 | 89 | 94 | 87 | 89 | 75 | 84 | 74 | 76 | 78 | 87 | 89 |
| 2017 | 88 | 83 | 84 | 87 | 80 | 80 | 79 | 78 | 77 | 75 | 79 | 73 |
| 2018 | 85 | 83 | 85 | 80 | 71 | 62 | 63 | 70 | 65 | 75 | 89 | 74 |
| 2019 | 87 | 93 | 81 | 66 | 76 | 75 | 80 | 77 | 80 | 82 | 89 | 88 |
| 2020 | 90 | 84 | 76 | 45 | 64 | 71 | 73 | 75 | 85 | 85 | 85 | 91 |
| 2021 | 86 | 79 | 87 | 90 | 91 | 83 | 85 | 89 | 74 | 85 | 84 | 90 |
| 2022 | 90 | 97 | 87 | 84 | 82 | 83 | 79 | 87 | 75 | 92 | 91 | 96 |
| 2023 | 95 | 93 | 91 | 82 | 85 | 86 | 87 | 86 | 93 | 103 | 92 | 101 |
| 2024 | 88 | |||||||||||
| - = No Data Reported; -- = Not Applicable; NA = Not Available; W = Withheld to avoid disclosure of individual company data. |
| Release Date: 3/29/2024 |
| Next Release Date: 4/30/2024 |