|
Download Data (XLS File) |
|
||||||||
|
||||||||
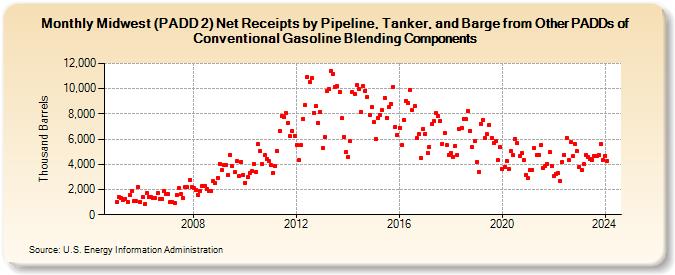
| Midwest (PADD 2) Net Receipts by Pipeline, Tanker, and Barge from Other PADDs of Conventional Gasoline Blending Components (Thousand Barrels) | ||||||||
| Year | Jan | Feb | Mar | Apr | May | Jun | Jul | Aug | Sep | Oct | Nov | Dec |
|---|---|---|---|---|---|---|---|---|---|---|---|---|
| 2005 | 977 | 1,390 | 1,317 | 1,196 | 1,265 | 1,012 | 1,547 | 1,904 | 1,061 | 1,063 | 2,185 | 1,022 |
| 2006 | 1,393 | 816 | 1,698 | 1,386 | 1,404 | 1,323 | 1,315 | 1,738 | 1,227 | 1,252 | 1,847 | 1,630 |
| 2007 | 1,644 | 1,037 | 1,005 | 936 | 1,595 | 2,123 | 1,655 | 1,312 | 2,199 | 2,167 | 2,785 | 2,216 |
| 2008 | 2,086 | 1,983 | 1,593 | 1,897 | 2,307 | 2,312 | 2,010 | 1,915 | 1,890 | 2,649 | 2,532 | 2,919 |
| 2009 | 4,058 | 3,538 | 3,935 | 3,962 | 3,139 | 4,757 | 3,845 | 3,367 | 4,229 | 3,040 | 4,209 | 3,184 |
| 2010 | 2,538 | 2,958 | 3,302 | 3,458 | 4,034 | 3,371 | 5,574 | 5,023 | 4,037 | 4,700 | 4,411 | 4,225 |
| 2011 | 3,920 | 3,302 | 3,828 | 5,041 | 6,626 | 7,821 | 7,726 | 8,090 | 7,292 | 6,222 | 6,623 | 6,277 |
| 2012 | 5,529 | 4,305 | 5,520 | 7,633 | 8,700 | 10,964 | 10,511 | 10,817 | 8,098 | 8,593 | 7,281 | 8,157 |
| 2013 | 5,313 | 6,141 | 9,833 | 9,978 | 11,407 | 11,202 | 10,102 | 10,192 | 9,735 | 7,652 | 6,206 | 4,978 |
| 2014 | 4,595 | 5,819 | 9,706 | 9,606 | 10,291 | 10,000 | 8,169 | 10,210 | 9,856 | 9,351 | 7,912 | 8,528 |
| 2015 | 7,329 | 6,016 | 7,706 | 7,937 | 8,278 | 9,281 | 7,706 | 8,522 | 8,814 | 10,167 | 6,991 | 6,350 |
| 2016 | 6,912 | 5,500 | 7,545 | 9,054 | 8,845 | 9,929 | 8,306 | 8,604 | 6,081 | 6,421 | 4,482 | 6,823 |
| 2017 | 6,427 | 4,898 | 5,406 | 7,168 | 7,398 | 8,068 | 7,812 | 7,472 | 5,643 | 6,497 | 5,507 | 4,729 |
| 2018 | 4,906 | 4,614 | 5,472 | 4,768 | 6,840 | 6,887 | 7,621 | 7,572 | 8,226 | 6,651 | 5,351 | 5,830 |
| 2019 | 4,168 | 3,413 | 7,210 | 7,546 | 6,103 | 6,366 | 7,142 | 6,088 | 5,706 | 5,824 | 4,305 | 5,361 |
| 2020 | 3,657 | 3,793 | 4,297 | 3,602 | 5,036 | 4,710 | 5,994 | 5,666 | 4,667 | 4,905 | 4,372 | 3,176 |
| 2021 | 2,876 | 3,558 | 3,585 | 5,262 | 4,737 | 4,745 | 5,525 | 3,738 | 3,864 | 4,054 | 4,973 | 3,897 |
| 2022 | 3,076 | 3,248 | 3,296 | 2,679 | 4,220 | 4,743 | 6,108 | 4,304 | 5,764 | 4,672 | 5,579 | 5,035 |
| 2023 | 3,767 | 3,526 | 3,999 | 4,750 | 4,595 | 4,431 | 4,380 | 4,697 | 4,693 | 4,716 | 5,606 | 4,325 |
| 2024 | 4,690 | |||||||||||
| - = No Data Reported; -- = Not Applicable; NA = Not Available; W = Withheld to avoid disclosure of individual company data. |
| Release Date: 3/29/2024 |
| Next Release Date: 4/30/2024 |
Referring Pages: