|
Download Data (XLS File) |
|
||||||||
|
||||||||
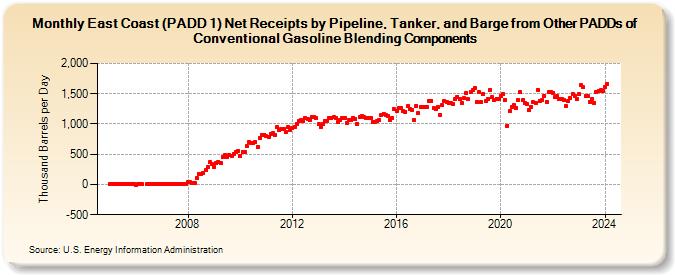
| East Coast (PADD 1) Net Receipts by Pipeline, Tanker, and Barge from Other PADDs of Conventional Gasoline Blending Components (Thousand Barrels per Day) | ||||||||
| Year | Jan | Feb | Mar | Apr | May | Jun | Jul | Aug | Sep | Oct | Nov | Dec |
|---|---|---|---|---|---|---|---|---|---|---|---|---|
| 2005 | 1 | 4 | 13 | 6 | 9 | 8 | 11 | 7 | 1 | 1 | 4 | 7 |
| 2006 | -3 | 8 | 4 | 2 | 0 | 4 | 14 | 8 | 6 | 14 | 7 | |
| 2007 | 0 | 4 | 1 | 12 | 12 | 13 | 10 | 15 | 12 | 14 | 14 | 15 |
| 2008 | 43 | 40 | 19 | 21 | 109 | 181 | 181 | 189 | 236 | 286 | 367 | 332 |
| 2009 | 295 | 351 | 374 | 349 | 447 | 489 | 452 | 490 | 471 | 510 | 543 | 558 |
| 2010 | 478 | 543 | 534 | 634 | 701 | 693 | 693 | 702 | 626 | 768 | 824 | 826 |
| 2011 | 799 | 791 | 838 | 850 | 823 | 946 | 899 | 918 | 911 | 869 | 953 | 903 |
| 2012 | 930 | 955 | 999 | 1,048 | 1,064 | 1,055 | 1,099 | 1,083 | 1,068 | 1,115 | 1,123 | 1,097 |
| 2013 | 996 | 954 | 995 | 1,048 | 1,053 | 1,093 | 1,091 | 1,112 | 1,094 | 1,032 | 1,072 | 1,100 |
| 2014 | 1,098 | 1,020 | 1,064 | 1,059 | 1,105 | 1,084 | 1,007 | 1,119 | 1,130 | 1,111 | 1,097 | 1,094 |
| 2015 | 1,101 | 1,039 | 1,035 | 1,052 | 1,060 | 1,149 | 1,171 | 1,144 | 1,138 | 1,061 | 1,100 | 1,242 |
| 2016 | 1,219 | 1,266 | 1,260 | 1,211 | 1,203 | 1,289 | 1,248 | 1,228 | 1,072 | 1,294 | 1,181 | 1,283 |
| 2017 | 1,274 | 1,285 | 1,279 | 1,377 | 1,388 | 1,264 | 1,241 | 1,280 | 1,155 | 1,312 | 1,381 | 1,357 |
| 2018 | 1,352 | 1,341 | 1,322 | 1,405 | 1,450 | 1,409 | 1,352 | 1,428 | 1,515 | 1,406 | 1,528 | 1,558 |
| 2019 | 1,600 | 1,366 | 1,528 | 1,365 | 1,498 | 1,387 | 1,421 | 1,569 | 1,441 | 1,399 | 1,419 | 1,419 |
| 2020 | 1,470 | 1,489 | 1,392 | 973 | 1,209 | 1,282 | 1,312 | 1,257 | 1,404 | 1,526 | 1,392 | 1,342 |
| 2021 | 1,326 | 1,231 | 1,286 | 1,361 | 1,349 | 1,562 | 1,381 | 1,396 | 1,461 | 1,370 | 1,531 | 1,526 |
| 2022 | 1,509 | 1,439 | 1,460 | 1,405 | 1,411 | 1,392 | 1,292 | 1,386 | 1,426 | 1,497 | 1,463 | 1,410 |
| 2023 | 1,488 | 1,639 | 1,604 | 1,466 | 1,457 | 1,371 | 1,416 | 1,349 | 1,522 | 1,542 | 1,557 | 1,548 |
| 2024 | 1,617 | |||||||||||
| - = No Data Reported; -- = Not Applicable; NA = Not Available; W = Withheld to avoid disclosure of individual company data. |
| Release Date: 3/29/2024 |
| Next Release Date: 4/30/2024 |