|
Download Data (XLS File) |
|
||||||||
|
||||||||
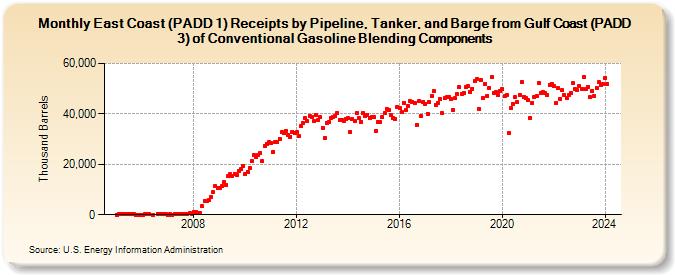
| East Coast (PADD 1) Receipts by Pipeline, Tanker, and Barge from Gulf Coast (PADD 3) of Conventional Gasoline Blending Components (Thousand Barrels) | ||||||||
| Year | Jan | Feb | Mar | Apr | May | Jun | Jul | Aug | Sep | Oct | Nov | Dec |
|---|---|---|---|---|---|---|---|---|---|---|---|---|
| 2005 | 0 | 105 | 264 | 184 | 282 | 209 | 326 | 331 | 125 | 76 | 60 | 0 |
| 2006 | 0 | 282 | 119 | 337 | 50 | 397 | 252 | 255 | 280 | 143 | ||
| 2007 | 9 | 107 | 24 | 447 | 359 | 419 | 368 | 465 | 305 | 444 | 513 | 363 |
| 2008 | 1,209 | 1,163 | 524 | 617 | 3,438 | 5,433 | 5,614 | 5,959 | 7,086 | 8,879 | 11,381 | 10,498 |
| 2009 | 10,594 | 11,247 | 12,855 | 11,894 | 15,245 | 15,979 | 15,228 | 16,278 | 15,679 | 17,439 | 17,988 | 19,399 |
| 2010 | 16,345 | 17,017 | 18,566 | 21,138 | 23,670 | 22,710 | 23,796 | 24,525 | 21,119 | 27,433 | 28,203 | 28,745 |
| 2011 | 28,322 | 24,995 | 28,769 | 28,771 | 30,066 | 32,689 | 32,260 | 33,335 | 31,717 | 30,934 | 32,925 | 32,241 |
| 2012 | 32,677 | 31,146 | 35,098 | 36,312 | 38,235 | 37,071 | 39,304 | 38,862 | 37,135 | 39,666 | 37,720 | 38,748 |
| 2013 | 34,582 | 30,575 | 36,502 | 36,920 | 38,564 | 38,784 | 39,294 | 40,433 | 37,664 | 37,459 | 37,350 | 38,111 |
| 2014 | 38,180 | 32,910 | 38,033 | 37,084 | 40,444 | 38,323 | 36,970 | 40,319 | 39,110 | 39,727 | 38,189 | 38,829 |
| 2015 | 38,816 | 33,268 | 36,747 | 36,763 | 38,585 | 40,499 | 42,019 | 41,611 | 39,649 | 38,507 | 37,969 | 42,726 |
| 2016 | 42,438 | 40,859 | 44,420 | 41,722 | 43,158 | 44,933 | 44,722 | 44,361 | 35,755 | 44,979 | 39,065 | 44,841 |
| 2017 | 43,958 | 40,086 | 44,654 | 47,072 | 48,938 | 43,652 | 44,486 | 45,779 | 40,226 | 46,386 | 46,544 | 46,717 |
| 2018 | 45,866 | 41,722 | 46,193 | 47,757 | 50,637 | 48,016 | 48,140 | 50,650 | 50,957 | 48,563 | 50,034 | 52,937 |
| 2019 | 53,793 | 42,095 | 53,339 | 46,375 | 51,852 | 47,130 | 50,290 | 54,708 | 48,482 | 48,503 | 47,386 | 49,195 |
| 2020 | 49,798 | 46,940 | 47,572 | 32,352 | 42,147 | 44,006 | 46,636 | 44,629 | 47,418 | 52,822 | 46,897 | 46,356 |
| 2021 | 45,412 | 38,524 | 44,329 | 46,810 | 47,014 | 52,386 | 48,402 | 48,773 | 48,376 | 47,527 | 51,610 | 51,985 |
| 2022 | 50,935 | 44,299 | 50,075 | 46,054 | 49,320 | 47,370 | 46,242 | 47,671 | 48,452 | 52,139 | 49,708 | 49,376 |
| 2023 | 51,054 | 50,033 | 54,796 | 49,865 | 50,801 | 46,573 | 49,217 | 47,220 | 50,443 | 52,530 | 51,548 | 51,821 |
| 2024 | 54,197 | 51,805 | 53,874 | 48,221 | 50,722 | 46,158 | ||||||
| - = No Data Reported; -- = Not Applicable; NA = Not Available; W = Withheld to avoid disclosure of individual company data. |
| Release Date: 8/30/2024 |
| Next Release Date: 9/30/2024 |