|
Download Data (XLS File) |
|
||||||||
|
||||||||
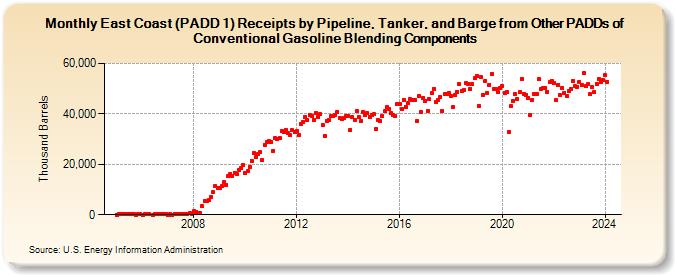
| East Coast (PADD 1) Receipts by Pipeline, Tanker, and Barge from Other PADDs of Conventional Gasoline Blending Components (Thousand Barrels) | ||||||||
| Year | Jan | Feb | Mar | Apr | May | Jun | Jul | Aug | Sep | Oct | Nov | Dec |
|---|---|---|---|---|---|---|---|---|---|---|---|---|
| 2005 | 67 | 162 | 418 | 184 | 282 | 228 | 326 | 331 | 125 | 76 | 112 | 266 |
| 2006 | 9 | 282 | 119 | 337 | 50 | 131 | 443 | 252 | 255 | 410 | 265 | |
| 2007 | 9 | 107 | 24 | 447 | 359 | 419 | 368 | 465 | 356 | 444 | 513 | 465 |
| 2008 | 1,344 | 1,163 | 587 | 617 | 3,438 | 5,433 | 5,615 | 5,959 | 7,087 | 8,880 | 11,409 | 10,501 |
| 2009 | 10,598 | 11,251 | 12,858 | 11,897 | 15,246 | 16,157 | 15,501 | 16,701 | 16,000 | 17,779 | 18,460 | 19,741 |
| 2010 | 16,579 | 17,213 | 18,839 | 21,496 | 24,472 | 23,051 | 24,200 | 24,840 | 21,690 | 27,844 | 28,688 | 29,238 |
| 2011 | 28,847 | 25,425 | 30,241 | 29,993 | 30,479 | 33,170 | 32,669 | 33,694 | 32,316 | 31,459 | 33,436 | 32,939 |
| 2012 | 33,213 | 31,786 | 35,939 | 36,891 | 38,813 | 37,755 | 39,752 | 39,358 | 37,771 | 40,474 | 38,876 | 39,788 |
| 2013 | 35,738 | 31,406 | 37,122 | 37,596 | 39,071 | 39,209 | 39,708 | 40,921 | 38,369 | 38,124 | 38,303 | 39,248 |
| 2014 | 39,285 | 33,753 | 38,714 | 37,622 | 40,978 | 38,809 | 37,354 | 40,715 | 39,516 | 40,324 | 38,880 | 39,610 |
| 2015 | 39,845 | 34,137 | 37,548 | 37,282 | 39,109 | 40,983 | 42,582 | 42,071 | 40,289 | 39,584 | 39,102 | 44,122 |
| 2016 | 43,857 | 41,987 | 45,602 | 42,729 | 44,173 | 45,793 | 45,606 | 45,330 | 36,998 | 47,131 | 40,805 | 46,440 |
| 2017 | 45,181 | 41,232 | 45,848 | 48,166 | 50,069 | 44,606 | 45,419 | 46,795 | 41,211 | 47,704 | 47,811 | 48,333 |
| 2018 | 47,192 | 42,818 | 47,386 | 48,736 | 51,699 | 48,980 | 49,377 | 52,121 | 52,018 | 49,939 | 51,670 | 54,151 |
| 2019 | 55,052 | 43,204 | 54,501 | 47,654 | 53,162 | 48,290 | 51,526 | 55,960 | 49,842 | 49,736 | 48,611 | 50,288 |
| 2020 | 51,066 | 48,322 | 48,870 | 32,944 | 42,992 | 45,186 | 47,795 | 45,780 | 48,581 | 53,908 | 47,966 | 47,404 |
| 2021 | 46,503 | 39,488 | 45,561 | 48,014 | 48,036 | 53,648 | 49,826 | 50,104 | 50,098 | 48,830 | 52,634 | 53,215 |
| 2022 | 52,067 | 45,384 | 51,581 | 47,362 | 50,428 | 48,468 | 47,282 | 49,138 | 49,867 | 53,174 | 50,985 | 50,851 |
| 2023 | 52,735 | 51,372 | 56,100 | 50,934 | 51,850 | 47,778 | 50,646 | 48,681 | 51,852 | 53,934 | 52,814 | 53,337 |
| 2024 | 55,317 | |||||||||||
| - = No Data Reported; -- = Not Applicable; NA = Not Available; W = Withheld to avoid disclosure of individual company data. |
| Release Date: 3/29/2024 |
| Next Release Date: 4/30/2024 |
Referring Pages: