|
Download Data (XLS File) |
|
||||||||
|
||||||||
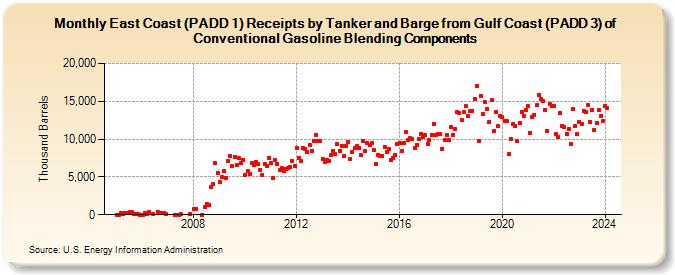
| East Coast (PADD 1) Receipts by Tanker and Barge from Gulf Coast (PADD 3) of Conventional Gasoline Blending Components (Thousand Barrels) | ||||||||
| Year | Jan | Feb | Mar | Apr | May | Jun | Jul | Aug | Sep | Oct | Nov | Dec |
|---|---|---|---|---|---|---|---|---|---|---|---|---|
| 2005 | 0 | 0 | 264 | 50 | 282 | 209 | 326 | 331 | 125 | 76 | 55 | 0 |
| 2006 | 0 | 282 | 90 | 301 | 50 | 397 | 220 | 255 | 174 | 30 | ||
| 2007 | 0 | 0 | 69 | 100 | ||||||||
| 2008 | 813 | 756 | 0 | 1,004 | 1,433 | 1,235 | 3,682 | 4,071 | 6,803 | 5,527 | ||
| 2009 | 4,292 | 4,937 | 5,810 | 4,920 | 7,156 | 7,782 | 6,402 | 7,691 | 6,625 | 7,493 | 6,881 | 7,260 |
| 2010 | 5,239 | 5,783 | 5,323 | 6,859 | 6,605 | 7,006 | 6,709 | 5,972 | 5,228 | 6,646 | 6,466 | 7,515 |
| 2011 | 6,828 | 4,910 | 7,218 | 6,644 | 5,907 | 6,139 | 5,796 | 6,086 | 6,190 | 6,304 | 7,143 | 6,434 |
| 2012 | 8,834 | 7,481 | 7,166 | 8,827 | 8,681 | 8,274 | 9,254 | 8,424 | 9,813 | 10,602 | 9,729 | 9,730 |
| 2013 | 7,427 | 7,010 | 7,270 | 7,039 | 7,896 | 8,396 | 7,995 | 9,388 | 8,424 | 9,150 | 7,745 | 9,072 |
| 2014 | 9,572 | 7,365 | 8,253 | 8,759 | 9,034 | 8,822 | 7,875 | 9,697 | 8,371 | 9,472 | 9,228 | 9,471 |
| 2015 | 8,559 | 6,666 | 7,949 | 7,795 | 7,745 | 8,989 | 8,301 | 8,644 | 7,279 | 7,518 | 7,913 | 9,378 |
| 2016 | 9,526 | 8,387 | 9,440 | 11,001 | 9,941 | 10,100 | 9,967 | 8,819 | 9,252 | 10,033 | 10,728 | 10,294 |
| 2017 | 10,519 | 9,402 | 9,871 | 10,589 | 12,018 | 10,517 | 10,631 | 10,625 | 8,749 | 9,878 | 10,509 | 9,898 |
| 2018 | 11,596 | 10,520 | 11,323 | 13,526 | 13,503 | 12,472 | 13,566 | 14,350 | 13,088 | 13,728 | 13,755 | 15,368 |
| 2019 | 17,002 | 9,697 | 15,751 | 13,344 | 14,863 | 13,979 | 12,300 | 15,160 | 11,056 | 13,620 | 11,749 | 13,041 |
| 2020 | 12,860 | 12,410 | 12,375 | 7,975 | 10,062 | 11,962 | 11,770 | 9,729 | 12,091 | 13,623 | 13,002 | 13,892 |
| 2021 | 14,318 | 10,778 | 12,874 | 13,252 | 14,450 | 15,812 | 15,313 | 14,982 | 13,883 | 11,131 | 14,642 | 14,370 |
| 2022 | 14,383 | 10,632 | 10,294 | 13,493 | 11,778 | 11,544 | 10,722 | 11,394 | 9,341 | 13,982 | 11,748 | 10,664 |
| 2023 | 12,317 | 12,038 | 13,739 | 13,537 | 14,525 | 12,296 | 13,882 | 11,244 | 12,177 | 13,871 | 13,004 | 12,389 |
| 2024 | 14,390 | |||||||||||
| - = No Data Reported; -- = Not Applicable; NA = Not Available; W = Withheld to avoid disclosure of individual company data. |
| Release Date: 3/29/2024 |
| Next Release Date: 4/30/2024 |