|
Download Data (XLS File) |
|
||||||||
|
||||||||
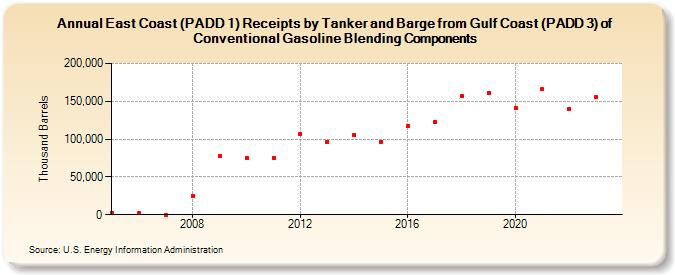
| East Coast (PADD 1) Receipts by Tanker and Barge from Gulf Coast (PADD 3) of Conventional Gasoline Blending Components (Thousand Barrels) | ||||||||
| Decade | Year-0 | Year-1 | Year-2 | Year-3 | Year-4 | Year-5 | Year-6 | Year-7 | Year-8 | Year-9 |
|---|---|---|---|---|---|---|---|---|---|---|
| 2000's | 1,718 | 1,799 | 169 | 25,324 | 77,249 | |||||
| 2010's | 75,351 | 75,599 | 106,815 | 96,812 | 105,919 | 96,736 | 117,488 | 123,206 | 156,795 | 161,562 |
| 2020's | 141,751 | 165,805 | 139,975 | 155,019 |
| - = No Data Reported; -- = Not Applicable; NA = Not Available; W = Withheld to avoid disclosure of individual company data. |
| Release Date: 8/30/2024 |
| Next Release Date: 8/29/2025 |