|
Download Data (XLS File) |
|
||||||||
|
||||||||
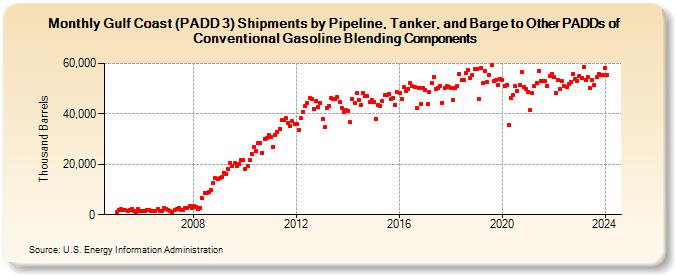
| Gulf Coast (PADD 3) Shipments by Pipeline, Tanker, and Barge to Other PADDs of Conventional Gasoline Blending Components (Thousand Barrels) | ||||||||
| Year | Jan | Feb | Mar | Apr | May | Jun | Jul | Aug | Sep | Oct | Nov | Dec |
|---|---|---|---|---|---|---|---|---|---|---|---|---|
| 2005 | 1,164 | 1,945 | 2,224 | 1,711 | 1,749 | 1,649 | 1,980 | 2,450 | 1,428 | 1,231 | 2,408 | 1,487 |
| 2006 | 1,402 | 1,398 | 1,991 | 1,749 | 1,461 | 1,516 | 1,541 | 2,276 | 1,621 | 1,670 | 2,543 | 2,243 |
| 2007 | 1,842 | 1,502 | 1,085 | 1,821 | 2,079 | 2,634 | 2,063 | 1,886 | 2,681 | 2,636 | 3,412 | 2,806 |
| 2008 | 3,433 | 3,243 | 2,333 | 2,585 | 6,590 | 8,644 | 8,736 | 8,973 | 9,838 | 12,636 | 14,646 | 14,263 |
| 2009 | 14,396 | 14,839 | 16,736 | 16,117 | 18,137 | 20,690 | 19,144 | 20,351 | 19,449 | 20,230 | 21,838 | 21,780 |
| 2010 | 18,225 | 19,190 | 21,579 | 24,097 | 26,934 | 25,343 | 28,382 | 28,311 | 24,421 | 30,184 | 30,567 | 31,428 |
| 2011 | 30,966 | 26,997 | 31,780 | 32,806 | 34,024 | 37,773 | 37,417 | 38,200 | 36,359 | 35,063 | 36,998 | 35,836 |
| 2012 | 36,025 | 33,427 | 38,279 | 40,680 | 43,232 | 44,319 | 46,263 | 46,003 | 41,936 | 45,124 | 42,762 | 44,183 |
| 2013 | 37,980 | 34,604 | 42,391 | 43,271 | 46,375 | 46,007 | 46,018 | 46,831 | 44,713 | 42,506 | 40,835 | 41,515 |
| 2014 | 41,326 | 36,664 | 45,949 | 44,272 | 48,156 | 45,647 | 43,533 | 48,312 | 46,927 | 47,078 | 44,584 | 45,696 |
| 2015 | 44,692 | 38,124 | 43,538 | 43,250 | 44,970 | 47,298 | 47,374 | 47,978 | 45,952 | 46,449 | 43,682 | 48,581 |
| 2016 | 48,331 | 45,711 | 50,556 | 49,145 | 50,055 | 52,191 | 51,126 | 50,569 | 42,150 | 50,445 | 43,842 | 50,078 |
| 2017 | 49,394 | 43,935 | 48,526 | 52,261 | 54,658 | 49,937 | 50,280 | 51,019 | 44,368 | 50,434 | 50,918 | 50,683 |
| 2018 | 50,413 | 45,370 | 50,379 | 51,086 | 55,833 | 53,356 | 53,478 | 56,084 | 57,593 | 54,288 | 55,422 | 57,815 |
| 2019 | 57,939 | 45,824 | 58,232 | 52,181 | 56,878 | 52,489 | 55,485 | 59,352 | 52,985 | 53,519 | 51,503 | 53,741 |
| 2020 | 53,636 | 50,993 | 51,400 | 35,767 | 46,418 | 47,522 | 51,080 | 49,165 | 51,492 | 56,732 | 50,657 | 49,828 |
| 2021 | 48,555 | 41,400 | 48,338 | 51,055 | 52,269 | 57,076 | 53,080 | 53,083 | 52,880 | 51,188 | 55,044 | 55,877 |
| 2022 | 54,674 | 48,376 | 53,614 | 49,702 | 52,942 | 51,228 | 50,808 | 51,893 | 52,739 | 56,009 | 53,969 | 53,160 |
| 2023 | 54,875 | 54,147 | 58,709 | 53,479 | 54,714 | 50,267 | 53,436 | 51,291 | 54,629 | 56,003 | 55,528 | 55,610 |
| 2024 | 58,037 | |||||||||||
| - = No Data Reported; -- = Not Applicable; NA = Not Available; W = Withheld to avoid disclosure of individual company data. |
| Release Date: 3/29/2024 |
| Next Release Date: 4/30/2024 |
Referring Pages: