|
Download Data (XLS File) |
|
||||||||
|
||||||||
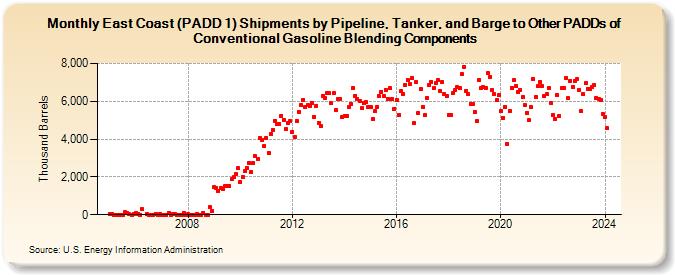
| East Coast (PADD 1) Shipments by Pipeline, Tanker, and Barge to Other PADDs of Conventional Gasoline Blending Components (Thousand Barrels) | ||||||||
| Year | Jan | Feb | Mar | Apr | May | Jun | Jul | Aug | Sep | Oct | Nov | Dec |
|---|---|---|---|---|---|---|---|---|---|---|---|---|
| 2005 | 45 | 45 | 0 | 0 | 0 | 0 | 0 | 125 | 110 | 45 | 0 | 50 |
| 2006 | 91 | 61 | 0 | 290 | 42 | 0 | 0 | 0 | 60 | 0 | 52 | |
| 2007 | 0 | 0 | 0 | 99 | 0 | 40 | 50 | 0 | 0 | 0 | 101 | 0 |
| 2008 | 22 | 0 | 0 | 0 | 45 | 0 | 0 | 104 | 0 | 0 | 386 | 220 |
| 2009 | 1,453 | 1,412 | 1,267 | 1,425 | 1,374 | 1,493 | 1,494 | 1,507 | 1,874 | 1,979 | 2,163 | 2,449 |
| 2010 | 1,755 | 2,009 | 2,292 | 2,477 | 2,756 | 2,272 | 2,721 | 3,092 | 2,921 | 4,050 | 3,977 | 3,640 |
| 2011 | 4,077 | 3,271 | 4,249 | 4,496 | 4,972 | 4,776 | 4,801 | 5,231 | 4,984 | 4,530 | 4,846 | 4,931 |
| 2012 | 4,378 | 4,105 | 4,966 | 5,453 | 5,821 | 6,092 | 5,690 | 5,783 | 5,727 | 5,911 | 5,186 | 5,770 |
| 2013 | 4,866 | 4,696 | 6,280 | 6,153 | 6,438 | 6,422 | 5,889 | 6,436 | 5,550 | 6,118 | 6,132 | 5,150 |
| 2014 | 5,247 | 5,205 | 5,718 | 5,866 | 6,716 | 6,295 | 6,141 | 6,017 | 5,630 | 5,886 | 5,962 | 5,704 |
| 2015 | 5,708 | 5,056 | 5,467 | 5,721 | 6,254 | 6,516 | 6,279 | 6,622 | 6,144 | 6,687 | 6,099 | 5,609 |
| 2016 | 6,056 | 5,280 | 6,529 | 6,387 | 6,869 | 7,137 | 6,923 | 7,252 | 4,849 | 7,012 | 5,376 | 6,656 |
| 2017 | 5,699 | 5,255 | 6,185 | 6,851 | 7,036 | 6,678 | 6,953 | 7,111 | 6,555 | 7,043 | 6,385 | 6,279 |
| 2018 | 5,283 | 5,281 | 6,416 | 6,596 | 6,739 | 6,704 | 7,453 | 7,840 | 6,565 | 6,364 | 5,844 | 5,852 |
| 2019 | 5,447 | 4,955 | 7,143 | 6,693 | 6,731 | 6,693 | 7,474 | 7,310 | 6,602 | 6,377 | 6,043 | 6,309 |
| 2020 | 5,481 | 5,134 | 5,705 | 3,749 | 5,498 | 6,723 | 7,119 | 6,807 | 6,471 | 6,603 | 6,216 | 5,798 |
| 2021 | 5,401 | 5,008 | 5,698 | 7,172 | 6,222 | 6,792 | 7,012 | 6,832 | 6,269 | 6,369 | 6,719 | 5,898 |
| 2022 | 5,277 | 5,085 | 6,327 | 5,211 | 6,679 | 6,715 | 7,233 | 6,168 | 7,098 | 6,770 | 7,090 | 7,153 |
| 2023 | 6,601 | 5,469 | 6,389 | 6,952 | 6,670 | 6,651 | 6,764 | 6,860 | 6,181 | 6,136 | 6,090 | 5,335 |
| 2024 | 5,186 | |||||||||||
| - = No Data Reported; -- = Not Applicable; NA = Not Available; W = Withheld to avoid disclosure of individual company data. |
| Release Date: 3/29/2024 |
| Next Release Date: 4/30/2024 |
Referring Pages: