|
Download Data (XLS File) |
|
||||||||
|
||||||||
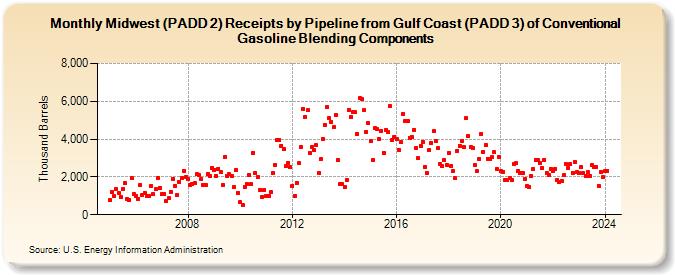
| Midwest (PADD 2) Receipts by Pipeline from Gulf Coast (PADD 3) of Conventional Gasoline Blending Components (Thousand Barrels) | ||||||||
| Year | Jan | Feb | Mar | Apr | May | Jun | Jul | Aug | Sep | Oct | Nov | Dec |
|---|---|---|---|---|---|---|---|---|---|---|---|---|
| 2005 | 777 | 1,181 | 972 | 1,352 | 1,144 | 946 | 1,361 | 1,673 | 817 | 767 | 1,922 | 1,099 |
| 2006 | 984 | 844 | 1,577 | 1,059 | 1,153 | 984 | 984 | 1,540 | 1,076 | 1,342 | 1,955 | 1,420 |
| 2007 | 1,079 | 1,093 | 734 | 867 | 1,219 | 1,903 | 1,539 | 1,055 | 1,736 | 1,951 | 2,336 | 2,003 |
| 2008 | 1,896 | 1,547 | 1,615 | 1,662 | 2,129 | 2,078 | 1,891 | 1,584 | 1,563 | 2,170 | 2,031 | 2,486 |
| 2009 | 2,389 | 2,049 | 2,437 | 2,241 | 1,581 | 3,077 | 2,055 | 2,132 | 2,022 | 1,463 | 2,350 | 1,175 |
| 2010 | 654 | 507 | 1,488 | 1,634 | 2,118 | 1,603 | 3,285 | 2,200 | 2,007 | 1,331 | 947 | 1,326 |
| 2011 | 978 | 1,008 | 1,188 | 2,199 | 2,637 | 3,926 | 3,959 | 3,653 | 3,498 | 2,560 | 2,758 | 2,524 |
| 2012 | 1,540 | 1,010 | 1,693 | 2,721 | 3,608 | 5,607 | 5,164 | 5,518 | 3,266 | 3,608 | 3,403 | 3,675 |
| 2013 | 2,183 | 2,933 | 4,024 | 4,764 | 5,675 | 5,098 | 4,899 | 4,621 | 5,253 | 2,898 | 1,631 | 1,607 |
| 2014 | 1,446 | 1,860 | 5,553 | 5,171 | 5,446 | 5,418 | 4,288 | 6,157 | 6,097 | 5,524 | 4,388 | 4,831 |
| 2015 | 3,887 | 2,868 | 4,569 | 4,540 | 4,024 | 4,436 | 3,281 | 4,473 | 4,400 | 5,745 | 3,947 | 4,128 |
| 2016 | 3,999 | 3,428 | 3,844 | 5,345 | 4,953 | 4,944 | 4,076 | 4,135 | 4,506 | 3,534 | 2,989 | 3,643 |
| 2017 | 3,865 | 2,549 | 2,205 | 3,422 | 3,817 | 4,421 | 3,908 | 3,522 | 2,693 | 2,562 | 2,898 | 2,644 |
| 2018 | 3,288 | 2,580 | 2,314 | 1,939 | 3,396 | 3,659 | 3,908 | 3,560 | 5,092 | 4,161 | 3,588 | 3,526 |
| 2019 | 2,650 | 2,291 | 2,953 | 4,278 | 3,309 | 3,700 | 2,969 | 2,970 | 3,042 | 3,296 | 2,420 | 3,063 |
| 2020 | 2,310 | 2,276 | 1,860 | 1,840 | 1,927 | 1,818 | 2,661 | 2,716 | 2,328 | 2,219 | 2,206 | 1,886 |
| 2021 | 1,538 | 1,470 | 2,067 | 2,411 | 2,903 | 2,881 | 2,727 | 2,482 | 2,899 | 2,197 | 2,078 | 2,426 |
| 2022 | 2,297 | 2,432 | 1,845 | 1,710 | 1,793 | 2,076 | 2,682 | 2,471 | 2,679 | 2,223 | 2,783 | 2,244 |
| 2023 | 2,192 | 2,514 | 2,195 | 2,026 | 2,239 | 2,068 | 2,626 | 2,502 | 2,518 | 1,525 | 2,248 | 1,981 |
| 2024 | 2,319 | 2,330 | ||||||||||
| - = No Data Reported; -- = Not Applicable; NA = Not Available; W = Withheld to avoid disclosure of individual company data. |
| Release Date: 4/30/2024 |
| Next Release Date: 5/31/2024 |