|
Download Data (XLS File) |
|
||||||||
|
||||||||
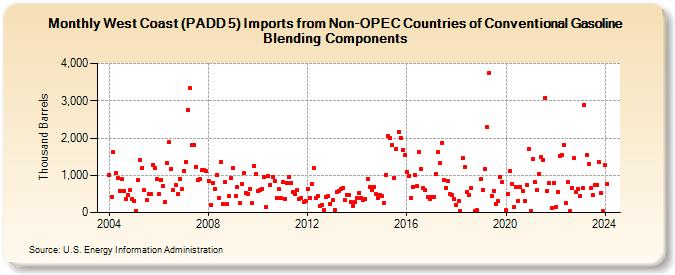
| West Coast (PADD 5) Imports from Non-OPEC Countries of Conventional Gasoline Blending Components (Thousand Barrels) | ||||||||
| Year | Jan | Feb | Mar | Apr | May | Jun | Jul | Aug | Sep | Oct | Nov | Dec |
|---|---|---|---|---|---|---|---|---|---|---|---|---|
| 2004 | 995 | 408 | 1,620 | 1,074 | 921 | 589 | 888 | 580 | 356 | 464 | 595 | 360 |
| 2005 | 313 | 50 | 871 | 1,405 | 1,205 | 592 | 337 | 485 | 489 | 1,276 | 1,188 | 895 |
| 2006 | 504 | 862 | 720 | 279 | 1,331 | 1,882 | 1,159 | 608 | 743 | 489 | 897 | 619 |
| 2007 | 1,123 | 1,363 | 2,757 | 3,329 | 1,810 | 1,823 | 1,218 | 880 | 904 | 1,130 | 1,146 | 1,104 |
| 2008 | 859 | 210 | 784 | 641 | 1,007 | 383 | 1,352 | 222 | 815 | 227 | 437 | 937 |
| 2009 | 1,194 | 436 | 675 | 246 | 779 | 1,062 | 537 | 511 | 627 | 260 | 1,251 | 1,040 |
| 2010 | 582 | 595 | 639 | 943 | 150 | 968 | 752 | 967 | 842 | 400 | 627 | 396 |
| 2011 | 814 | 375 | 806 | 949 | 795 | 545 | 500 | 592 | 373 | 385 | 276 | 318 |
| 2012 | 642 | 404 | 770 | 1,204 | 403 | 439 | 185 | 200 | 65 | 413 | 432 | 230 |
| 2013 | 325 | 75 | 561 | 576 | 633 | 668 | 342 | 465 | 476 | 283 | 185 | 282 |
| 2014 | 382 | 533 | 398 | 333 | 366 | 907 | 681 | 610 | 699 | 501 | 403 | 465 |
| 2015 | 434 | 260 | 1,014 | 2,062 | 1,999 | 1,812 | 931 | 1,705 | 2,171 | 2,002 | 1,682 | 1,533 |
| 2016 | 1,101 | 979 | 388 | 689 | 1,021 | 710 | 1,634 | 1,180 | 669 | 614 | 426 | 358 |
| 2017 | 427 | 406 | 1,041 | 1,619 | 1,322 | 1,878 | 872 | 661 | 834 | 503 | 472 | 352 |
| 2018 | 202 | 323 | 54 | 1,456 | 1,222 | 543 | 476 | 649 | 52 | 57 | ||
| 2019 | 913 | 610 | 1,158 | 2,287 | 3,741 | 457 | 586 | 233 | 316 | 949 | 813 | |
| 2020 | 56 | 494 | 1,118 | 770 | 149 | 684 | 321 | 682 | 579 | 300 | 747 | 1,695 |
| 2021 | 39 | 1,434 | 819 | 617 | 1,044 | 1,486 | 1,419 | 3,086 | 580 | 786 | 120 | 805 |
| 2022 | 151 | 557 | 1,530 | 1,546 | 1,814 | 249 | 811 | 46 | 665 | 1,454 | 547 | 629 |
| 2023 | 457 | 661 | 2,887 | 1,547 | 1,306 | 655 | 464 | 750 | 742 | 1,361 | 523 | 33 |
| 2024 | 1,281 | |||||||||||
| - = No Data Reported; -- = Not Applicable; NA = Not Available; W = Withheld to avoid disclosure of individual company data. |
| Release Date: 3/29/2024 |
| Next Release Date: 4/30/2024 |