|
Download Data (XLS File) |
|
||||||||
|
||||||||
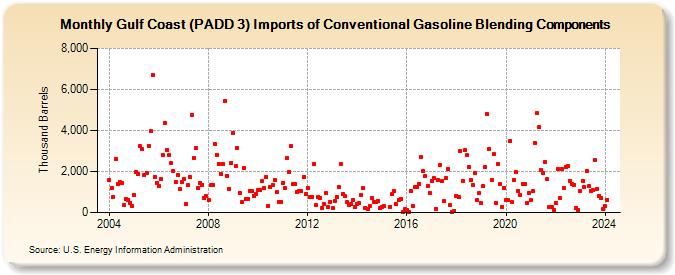
| Gulf Coast (PADD 3) Imports of Conventional Gasoline Blending Components (Thousand Barrels) | ||||||||
| Year | Jan | Feb | Mar | Apr | May | Jun | Jul | Aug | Sep | Oct | Nov | Dec |
|---|---|---|---|---|---|---|---|---|---|---|---|---|
| 2004 | 1,582 | 1,221 | 765 | 2,603 | 1,376 | 1,513 | 1,457 | 356 | 681 | 626 | 454 | 326 |
| 2005 | 875 | 1,987 | 1,857 | 3,223 | 3,084 | 1,820 | 1,907 | 3,254 | 3,981 | 6,690 | 1,722 | 1,458 |
| 2006 | 1,294 | 1,622 | 2,799 | 4,381 | 3,071 | 2,790 | 2,411 | 2,045 | 1,490 | 1,837 | 1,132 | 1,474 |
| 2007 | 1,618 | 405 | 1,319 | 1,755 | 4,757 | 2,660 | 3,152 | 1,202 | 1,435 | 1,351 | 715 | 798 |
| 2008 | 613 | 1,327 | 1,339 | 3,335 | 2,819 | 2,387 | 1,891 | 2,373 | 5,414 | 1,793 | 1,166 | 2,416 |
| 2009 | 3,901 | 2,253 | 3,168 | 971 | 492 | 2,195 | 660 | 655 | 1,070 | 1,047 | 797 | 911 |
| 2010 | 1,120 | 1,103 | 1,524 | 1,178 | 1,745 | 344 | 1,231 | 1,335 | 1,601 | 997 | 526 | 526 |
| 2011 | 1,459 | 1,189 | 2,664 | 1,996 | 3,226 | 1,392 | 1,370 | 1,004 | 1,065 | 1,045 | 1,734 | 883 |
| 2012 | 1,210 | 752 | 737 | 2,343 | 355 | 744 | 728 | 207 | 401 | 931 | 273 | 509 |
| 2013 | 221 | 575 | 751 | 1,258 | 2,344 | 915 | 794 | 497 | 386 | 417 | 611 | 249 |
| 2014 | 398 | 449 | 847 | 1,179 | 222 | 181 | 330 | 701 | 527 | 513 | 573 | 198 |
| 2015 | 285 | 297 | 286 | 883 | 1,046 | 398 | 610 | 679 | 24 | 150 | ||
| 2016 | 144 | 18 | 1,061 | 300 | 1,239 | 1,241 | 1,408 | 2,694 | 2,001 | 1,773 | 1,316 | 967 |
| 2017 | 1,553 | 1,685 | 195 | 1,583 | 2,329 | 1,524 | 560 | 1,692 | 2,140 | 352 | 26 | 89 |
| 2018 | 809 | 737 | 2,996 | 1,541 | 3,030 | 2,788 | 2,241 | 1,601 | 1,341 | 1,943 | 617 | 955 |
| 2019 | 445 | 1,293 | 2,196 | 4,780 | 3,109 | 1,591 | 2,832 | 474 | 2,373 | 1,381 | 292 | 1,221 |
| 2020 | 611 | 599 | 3,467 | 495 | 1,595 | 1,956 | 1,061 | 862 | 1,414 | 1,371 | 485 | 961 |
| 2021 | 604 | 1,031 | 3,410 | 4,834 | 4,149 | 2,062 | 1,939 | 2,467 | 1,616 | 285 | 256 | 134 |
| 2022 | 479 | 2,123 | 713 | 2,120 | 1,175 | 2,198 | 2,258 | 1,538 | 1,384 | 1,359 | 238 | 127 |
| 2023 | 1,028 | 1,542 | 1,250 | 2,038 | 1,283 | 1,035 | 1,084 | 2,555 | 1,170 | 828 | 704 | 189 |
| 2024 | 299 | |||||||||||
| - = No Data Reported; -- = Not Applicable; NA = Not Available; W = Withheld to avoid disclosure of individual company data. |
| Release Date: 3/29/2024 |
| Next Release Date: 4/30/2024 |