|
Download Data (XLS File) |
|
||||||||
|
||||||||
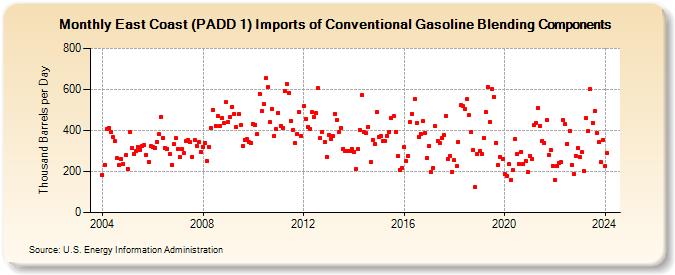
| East Coast (PADD 1) Imports of Conventional Gasoline Blending Components (Thousand Barrels per Day) | ||||||||
| Year | Jan | Feb | Mar | Apr | May | Jun | Jul | Aug | Sep | Oct | Nov | Dec |
|---|---|---|---|---|---|---|---|---|---|---|---|---|
| 2004 | 184 | 232 | 406 | 414 | 392 | 368 | 347 | 264 | 232 | 262 | 237 | 279 |
| 2005 | 214 | 392 | 315 | 287 | 299 | 321 | 305 | 326 | 330 | 282 | 248 | 323 |
| 2006 | 318 | 317 | 343 | 382 | 466 | 365 | 317 | 312 | 286 | 234 | 332 | 362 |
| 2007 | 312 | 270 | 310 | 291 | 349 | 354 | 342 | 272 | 355 | 326 | 343 | 297 |
| 2008 | 321 | 339 | 251 | 320 | 413 | 500 | 424 | 471 | 422 | 460 | 435 | 537 |
| 2009 | 443 | 465 | 515 | 480 | 416 | 479 | 426 | 324 | 356 | 357 | 344 | 337 |
| 2010 | 433 | 428 | 384 | 580 | 494 | 529 | 654 | 610 | 439 | 506 | 375 | 406 |
| 2011 | 487 | 423 | 410 | 592 | 626 | 585 | 448 | 404 | 339 | 383 | 490 | 373 |
| 2012 | 518 | 458 | 415 | 409 | 489 | 464 | 485 | 605 | 364 | 392 | 343 | 271 |
| 2013 | 379 | 359 | 373 | 482 | 453 | 395 | 413 | 312 | 301 | 299 | 300 | 312 |
| 2014 | 297 | 212 | 310 | 403 | 572 | 392 | 386 | 419 | 244 | 356 | 333 | 490 |
| 2015 | 370 | 373 | 351 | 348 | 374 | 395 | 461 | 470 | 394 | 275 | 209 | 217 |
| 2016 | 318 | 249 | 278 | 442 | 480 | 551 | 436 | 368 | 385 | 445 | 388 | 268 |
| 2017 | 325 | 199 | 218 | 420 | 349 | 339 | 362 | 378 | 472 | 262 | 276 | 200 |
| 2018 | 254 | 226 | 344 | 522 | 518 | 505 | 551 | 473 | 392 | 304 | 124 | 283 |
| 2019 | 299 | 286 | 363 | 489 | 613 | 442 | 602 | 563 | 340 | 230 | 270 | 259 |
| 2020 | 187 | 180 | 235 | 161 | 206 | 359 | 287 | 236 | 297 | 237 | 253 | 196 |
| 2021 | 278 | 263 | 426 | 437 | 510 | 424 | 349 | 339 | 449 | 281 | 306 | 229 |
| 2022 | 161 | 226 | 243 | 245 | 449 | 431 | 336 | 397 | 233 | 188 | 276 | 317 |
| 2023 | 270 | 295 | 202 | 460 | 398 | 600 | 438 | 493 | 388 | 342 | 244 | 356 |
| 2024 | 226 | |||||||||||
| - = No Data Reported; -- = Not Applicable; NA = Not Available; W = Withheld to avoid disclosure of individual company data. |
| Release Date: 3/29/2024 |
| Next Release Date: 4/30/2024 |