|
Download Data (XLS File) |
|
||||||||
|
||||||||
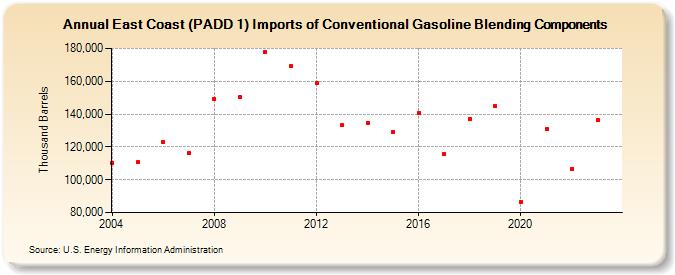
| East Coast (PADD 1) Imports of Conventional Gasoline Blending Components (Thousand Barrels) | ||||||||
| Decade | Year-0 | Year-1 | Year-2 | Year-3 | Year-4 | Year-5 | Year-6 | Year-7 | Year-8 | Year-9 |
|---|---|---|---|---|---|---|---|---|---|---|
| 2000's | 110,354 | 110,548 | 122,761 | 116,270 | 149,302 | 150,180 | ||||
| 2010's | 177,798 | 169,079 | 159,161 | 133,163 | 134,825 | 128,837 | 140,628 | 115,689 | 137,196 | 145,037 |
| 2020's | 86,437 | 130,653 | 106,729 | 136,436 |
| - = No Data Reported; -- = Not Applicable; NA = Not Available; W = Withheld to avoid disclosure of individual company data. |
| Release Date: 3/29/2024 |
| Next Release Date: 8/30/2024 |