|
Download Data (XLS File) |
|
||||||||
|
||||||||
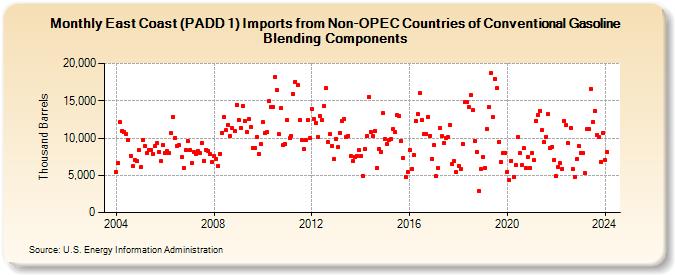
| East Coast (PADD 1) Imports from Non-OPEC Countries of Conventional Gasoline Blending Components (Thousand Barrels) | ||||||||
| Year | Jan | Feb | Mar | Apr | May | Jun | Jul | Aug | Sep | Oct | Nov | Dec |
|---|---|---|---|---|---|---|---|---|---|---|---|---|
| 2004 | 5,388 | 6,621 | 12,108 | 11,002 | 10,822 | 10,533 | 9,752 | 7,591 | 6,198 | 7,102 | 6,920 | 8,331 |
| 2005 | 6,100 | 9,689 | 8,929 | 7,931 | 8,439 | 8,399 | 7,913 | 8,914 | 9,289 | 8,161 | 6,912 | 9,007 |
| 2006 | 8,057 | 8,209 | 7,931 | 10,625 | 12,885 | 10,003 | 8,948 | 9,023 | 7,391 | 6,042 | 8,335 | 9,601 |
| 2007 | 8,367 | 6,589 | 8,121 | 7,790 | 8,266 | 7,953 | 9,337 | 6,982 | 8,420 | 8,316 | 7,850 | 6,789 |
| 2008 | 7,537 | 7,228 | 6,222 | 7,906 | 10,695 | 12,810 | 11,037 | 11,768 | 10,233 | 11,308 | 10,881 | 14,482 |
| 2009 | 12,426 | 11,338 | 14,348 | 12,329 | 10,747 | 12,485 | 11,500 | 8,635 | 8,708 | 10,113 | 7,881 | 9,156 |
| 2010 | 12,105 | 10,674 | 10,768 | 14,956 | 14,158 | 14,223 | 18,215 | 16,387 | 10,490 | 13,986 | 9,036 | 9,176 |
| 2011 | 12,438 | 9,958 | 10,287 | 15,929 | 17,569 | 17,164 | 12,435 | 9,751 | 8,556 | 9,731 | 12,450 | 9,943 |
| 2012 | 13,922 | 12,580 | 12,035 | 10,135 | 12,969 | 12,418 | 14,311 | 16,681 | 9,482 | 10,482 | 8,991 | 7,127 |
| 2013 | 9,921 | 8,785 | 10,707 | 12,239 | 12,543 | 10,133 | 10,273 | 7,538 | 6,905 | 7,435 | 7,598 | 8,391 |
| 2014 | 7,566 | 4,948 | 8,491 | 10,245 | 15,568 | 10,777 | 10,210 | 10,939 | 6,030 | 8,537 | 8,148 | 13,313 |
| 2015 | 9,826 | 9,180 | 9,741 | 9,825 | 11,145 | 10,793 | 13,115 | 12,948 | 9,593 | 7,383 | 4,706 | 5,442 |
| 2016 | 8,386 | 5,862 | 7,755 | 12,275 | 13,188 | 15,998 | 12,384 | 10,532 | 10,579 | 12,822 | 10,309 | 7,252 |
| 2017 | 9,020 | 4,859 | 5,994 | 11,314 | 10,220 | 9,384 | 9,970 | 10,131 | 11,780 | 6,529 | 6,853 | 5,378 |
| 2018 | 6,261 | 5,837 | 9,224 | 14,818 | 14,896 | 14,107 | 15,794 | 13,721 | 9,621 | 8,156 | 2,915 | 5,797 |
| 2019 | 7,473 | 6,031 | 11,213 | 14,169 | 18,673 | 12,755 | 17,933 | 16,690 | 9,512 | 6,782 | 8,054 | 8,021 |
| 2020 | 5,477 | 4,394 | 6,959 | 4,836 | 6,349 | 10,095 | 8,005 | 6,368 | 8,597 | 5,970 | 7,467 | 5,983 |
| 2021 | 8,014 | 7,082 | 12,350 | 13,095 | 13,687 | 11,044 | 9,463 | 10,186 | 13,176 | 8,715 | 8,844 | 7,108 |
| 2022 | 4,859 | 6,119 | 6,610 | 5,903 | 12,348 | 11,706 | 9,298 | 11,382 | 5,867 | 4,737 | 7,181 | 8,938 |
| 2023 | 8,047 | 7,983 | 5,279 | 11,155 | 11,260 | 16,642 | 12,192 | 13,672 | 10,421 | 10,103 | 6,824 | 10,713 |
| 2024 | 7,006 | |||||||||||
| - = No Data Reported; -- = Not Applicable; NA = Not Available; W = Withheld to avoid disclosure of individual company data. |
| Release Date: 3/29/2024 |
| Next Release Date: 4/30/2024 |