|
Download Data (XLS File) |
|
||||||||
|
||||||||
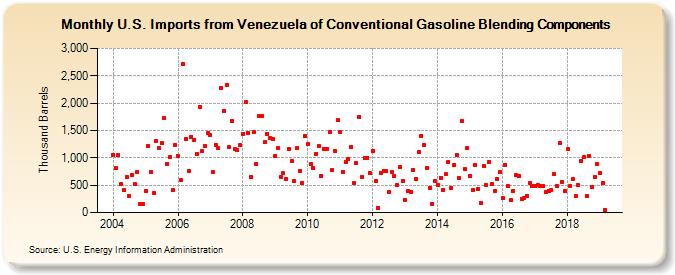
| U.S. Imports from Venezuela of Conventional Gasoline Blending Components (Thousand Barrels) | ||||||||
| Year | Jan | Feb | Mar | Apr | May | Jun | Jul | Aug | Sep | Oct | Nov | Dec |
|---|---|---|---|---|---|---|---|---|---|---|---|---|
| 2004 | 1,055 | 809 | 1,050 | 519 | 410 | 649 | 299 | 690 | 519 | 741 | 148 | 149 |
| 2005 | 403 | 1,212 | 741 | 359 | 1,302 | 1,177 | 1,267 | 1,731 | 895 | 1,014 | 406 | 1,230 |
| 2006 | 1,029 | 590 | 2,712 | 1,342 | 765 | 1,384 | 1,334 | 1,071 | 1,933 | 1,123 | 1,217 | 1,448 |
| 2007 | 1,415 | 738 | 1,237 | 1,174 | 2,268 | 1,848 | 2,338 | 1,193 | 1,665 | 1,154 | 1,136 | 1,232 |
| 2008 | 1,442 | 2,020 | 1,453 | 645 | 1,472 | 896 | 1,762 | 1,772 | 1,281 | 1,434 | 1,364 | 1,352 |
| 2009 | 1,030 | 1,171 | 651 | 721 | 614 | 1,160 | 934 | 574 | 1,179 | 766 | 538 | 1,398 |
| 2010 | 1,245 | 885 | 808 | 1,079 | 1,212 | 670 | 1,163 | 1,169 | 1,470 | 773 | 1,127 | 1,699 |
| 2011 | 1,477 | 733 | 922 | 976 | 1,194 | 540 | 902 | 1,753 | 650 | 1,003 | 1,004 | 714 |
| 2012 | 1,125 | 574 | 92 | 728 | 767 | 752 | 367 | 741 | 674 | 501 | 828 | 584 |
| 2013 | 230 | 396 | 380 | 779 | 611 | 1,101 | 1,408 | 1,236 | 822 | 455 | 164 | 574 |
| 2014 | 507 | 639 | 421 | 699 | 933 | 455 | 862 | 1,060 | 634 | 1,669 | 797 | 1,188 |
| 2015 | 673 | 410 | 866 | 438 | 175 | 858 | 503 | 925 | 521 | 398 | 613 | 733 |
| 2016 | 266 | 871 | 487 | 237 | 395 | 680 | 676 | 239 | 273 | 309 | 544 | 483 |
| 2017 | 487 | 499 | 478 | 487 | 377 | 402 | 419 | 703 | 485 | 1,270 | 552 | 396 |
| 2018 | 1,154 | 486 | 611 | 301 | 496 | 943 | 1,024 | 301 | 1,029 | 464 | 657 | 890 |
| 2019 | 732 | 532 | 42 | |||||||||
| - = No Data Reported; -- = Not Applicable; NA = Not Available; W = Withheld to avoid disclosure of individual company data. |
| Release Date: 3/29/2024 |
| Next Release Date: 4/30/2024 |