|
Download Data (XLS File) |
|
||||||||
|
||||||||
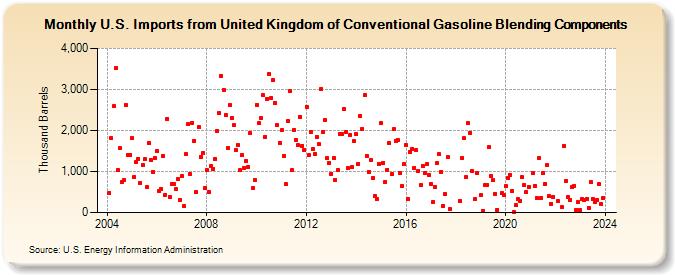
| U.S. Imports from United Kingdom of Conventional Gasoline Blending Components (Thousand Barrels) | ||||||||
| Year | Jan | Feb | Mar | Apr | May | Jun | Jul | Aug | Sep | Oct | Nov | Dec |
|---|---|---|---|---|---|---|---|---|---|---|---|---|
| 2004 | 482 | 1,812 | 2,587 | 3,520 | 1,031 | 1,566 | 744 | 795 | 2,620 | 1,403 | 1,397 | |
| 2005 | 1,806 | 872 | 1,244 | 1,316 | 726 | 1,161 | 1,294 | 626 | 1,694 | 1,272 | 993 | 1,341 |
| 2006 | 1,497 | 521 | 569 | 1,375 | 434 | 2,290 | 376 | 703 | 699 | 586 | 808 | 313 |
| 2007 | 894 | 155 | 1,416 | 2,149 | 933 | 2,190 | 1,750 | 497 | 2,083 | 1,360 | 1,446 | 604 |
| 2008 | 1,042 | 489 | 1,136 | 1,067 | 1,310 | 1,988 | 2,427 | 3,323 | 2,988 | 2,379 | 1,565 | 2,616 |
| 2009 | 2,313 | 2,124 | 1,529 | 1,643 | 1,030 | 1,391 | 1,090 | 1,254 | 1,114 | 1,928 | 589 | 788 |
| 2010 | 2,632 | 2,178 | 2,293 | 2,853 | 1,849 | 2,779 | 3,374 | 2,794 | 3,222 | 2,671 | 2,122 | 1,705 |
| 2011 | 2,005 | 1,368 | 688 | 2,235 | 2,958 | 1,026 | 2,015 | 1,773 | 1,641 | 2,339 | 1,633 | 1,533 |
| 2012 | 2,580 | 1,395 | 1,972 | 1,537 | 1,429 | 1,853 | 1,664 | 3,011 | 1,957 | 2,254 | 1,319 | 1,214 |
| 2013 | 951 | 1,330 | 795 | 1,041 | 1,919 | 1,926 | 2,517 | 1,964 | 1,080 | 1,900 | 1,108 | 1,735 |
| 2014 | 1,906 | 1,192 | 2,350 | 2,038 | 2,861 | 1,383 | 994 | 1,278 | 844 | 395 | 319 | 1,190 |
| 2015 | 2,177 | 1,219 | 752 | 1,048 | 1,691 | 930 | 2,024 | 1,744 | 1,774 | 968 | 648 | 1,177 |
| 2016 | 1,640 | 320 | 1,482 | 1,559 | 1,096 | 1,514 | 1,017 | 661 | 1,144 | 965 | 1,179 | 910 |
| 2017 | 700 | 258 | 632 | 1,211 | 1,419 | 998 | 163 | 446 | 1,346 | 76 | ||
| 2018 | 293 | 1,339 | 1,806 | 856 | 2,170 | 1,947 | 1,016 | 322 | 961 | |||
| 2019 | 427 | 49 | 666 | 681 | 1,587 | 883 | 787 | 453 | 70 | 474 | 432 | |
| 2020 | 637 | 839 | 923 | 536 | 16 | 178 | 320 | 292 | 858 | 668 | 500 | 621 |
| 2021 | 956 | 652 | 357 | 1,319 | 354 | 958 | 706 | 1,155 | 400 | 218 | 390 | |
| 2022 | 280 | 125 | 1,620 | 775 | 381 | 306 | 621 | 655 | 73 | 250 | ||
| 2023 | 51 | 330 | 302 | 340 | 121 | 747 | 333 | 269 | 316 | 689 | 217 | 366 |
| - = No Data Reported; -- = Not Applicable; NA = Not Available; W = Withheld to avoid disclosure of individual company data. |
| Release Date: 3/29/2024 |
| Next Release Date: 4/30/2024 |