|
Download Data (XLS File) |
|
||||||||
|
||||||||
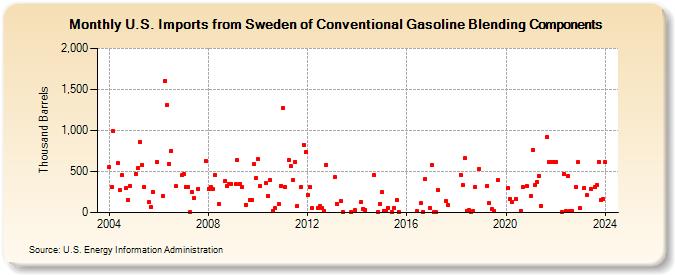
| U.S. Imports from Sweden of Conventional Gasoline Blending Components (Thousand Barrels) | ||||||||
| Year | Jan | Feb | Mar | Apr | May | Jun | Jul | Aug | Sep | Oct | Nov | Dec |
|---|---|---|---|---|---|---|---|---|---|---|---|---|
| 2004 | 558 | 313 | 989 | 600 | 275 | 454 | 294 | 150 | 329 | |||
| 2005 | 473 | 544 | 859 | 585 | 315 | 124 | 70 | 252 | 615 | |||
| 2006 | 198 | 1,607 | 1,312 | 597 | 756 | 320 | 452 | |||||
| 2007 | 468 | 316 | 307 | 1 | 250 | 179 | 293 | 627 | ||||
| 2008 | 288 | 311 | 285 | 457 | 107 | 389 | 322 | 346 | 350 | |||
| 2009 | 343 | 638 | 351 | 310 | 98 | 150 | 150 | 588 | 423 | |||
| 2010 | 647 | 326 | 355 | 207 | 395 | 19 | 50 | 102 | 329 | |||
| 2011 | 1,274 | 316 | 638 | 562 | 394 | 622 | 79 | 314 | 828 | 733 | ||
| 2012 | 215 | 314 | 54 | 52 | 79 | 50 | 20 | 580 | ||||
| 2013 | 432 | 110 | 142 | 9 | 2 | 26 | ||||||
| 2014 | 128 | 48 | 35 | 461 | 3 | 101 | ||||||
| 2015 | 250 | 21 | 20 | 61 | 3 | 58 | 154 | 11 | ||||
| 2016 | 17 | 114 | 4 | 410 | 60 | |||||||
| 2017 | 574 | 3 | 8 | 277 | 140 | 95 | ||||||
| 2018 | 461 | 335 | 661 | 25 | 28 | 11 | 15 | 316 | 536 | |||
| 2019 | 325 | 113 | 40 | 24 | 391 | |||||||
| 2020 | 299 | 165 | 129 | 163 | 20 | 311 | 321 | |||||
| 2021 | 203 | 762 | 340 | 370 | 448 | 83 | 917 | 613 | 617 | 614 | ||
| 2022 | 621 | 4 | 472 | 14 | 441 | 20 | 22 | 307 | 612 | |||
| 2023 | 50 | 300 | 210 | 293 | 308 | 331 | 621 | 157 | 160 | |||
| 2024 | 618 | |||||||||||
| - = No Data Reported; -- = Not Applicable; NA = Not Available; W = Withheld to avoid disclosure of individual company data. |
| Release Date: 3/29/2024 |
| Next Release Date: 4/30/2024 |