|
Download Data (XLS File) |
|
||||||||
|
||||||||
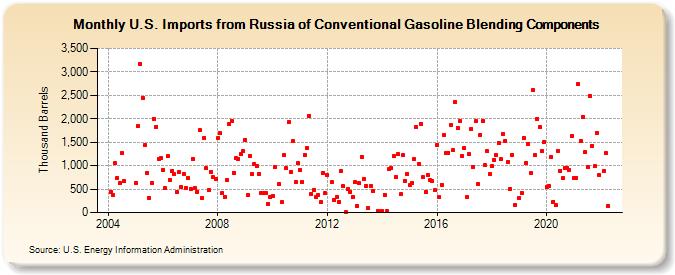
| U.S. Imports from Russia of Conventional Gasoline Blending Components (Thousand Barrels) | ||||||||
| Year | Jan | Feb | Mar | Apr | May | Jun | Jul | Aug | Sep | Oct | Nov | Dec |
|---|---|---|---|---|---|---|---|---|---|---|---|---|
| 2004 | 434 | 380 | 1,046 | 732 | 627 | 1,267 | 664 | |||||
| 2005 | 628 | 1,847 | 3,177 | 2,452 | 1,433 | 853 | 317 | 629 | 2,001 | 1,834 | 1,144 | 1,156 |
| 2006 | 909 | 520 | 1,196 | 701 | 892 | 813 | 435 | 872 | 539 | 823 | 533 | 739 |
| 2007 | 507 | 1,152 | 514 | 445 | 1,760 | 318 | 1,593 | 940 | 478 | 874 | 750 | 712 |
| 2008 | 1,584 | 1,693 | 414 | 337 | 693 | 1,894 | 1,955 | 851 | 1,153 | 1,146 | 1,251 | 1,303 |
| 2009 | 1,551 | 368 | 1,207 | 824 | 1,040 | 989 | 819 | 408 | 418 | 423 | 184 | 322 |
| 2010 | 351 | 979 | 606 | 219 | 1,223 | 943 | 1,930 | 868 | 1,515 | 651 | 1,051 | |
| 2011 | 913 | 656 | 1,226 | 1,381 | 2,064 | 397 | 490 | 331 | 371 | 217 | 847 | 408 |
| 2012 | 808 | 655 | 267 | 324 | 235 | 887 | 559 | 17 | 499 | 439 | 333 | |
| 2013 | 644 | 135 | 629 | 1,188 | 722 | 575 | 88 | 569 | 460 | 36 | ||
| 2014 | 29 | 385 | 23 | 922 | 946 | 1,202 | 761 | 1,247 | 386 | 1,227 | 680 | 826 |
| 2015 | 577 | 623 | 1,136 | 1,833 | 1,042 | 1,896 | 755 | 445 | 800 | 685 | 677 | 475 |
| 2016 | 1,438 | 323 | 597 | 1,644 | 1,264 | 1,270 | 1,870 | 1,324 | 2,365 | 1,812 | 1,957 | 1,214 |
| 2017 | 1,366 | 322 | 1,239 | 1,783 | 966 | 1,957 | 612 | 1,661 | 1,948 | 1,007 | 1,305 | 818 |
| 2018 | 989 | 1,122 | 1,223 | 1,490 | 1,134 | 1,679 | 1,534 | 1,075 | 505 | 1,234 | 163 | |
| 2019 | 316 | 423 | 1,590 | 1,053 | 1,459 | 836 | 2,607 | 1,223 | 2,002 | 1,824 | 1,309 | 1,503 |
| 2020 | 541 | 576 | 1,187 | 235 | 156 | 1,322 | 892 | 729 | 942 | 953 | 910 | 1,639 |
| 2021 | 741 | 737 | 2,741 | 1,536 | 2,043 | 1,283 | 965 | 2,492 | 1,424 | 985 | 1,703 | 798 |
| 2022 | 892 | 1,260 | 150 | |||||||||
| - = No Data Reported; -- = Not Applicable; NA = Not Available; W = Withheld to avoid disclosure of individual company data. |
| Release Date: 3/29/2024 |
| Next Release Date: 4/30/2024 |