|
Download Data (XLS File) |
|
||||||||
|
||||||||
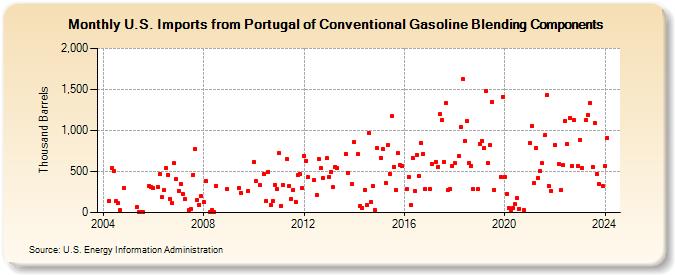
| U.S. Imports from Portugal of Conventional Gasoline Blending Components (Thousand Barrels) | ||||||||
| Year | Jan | Feb | Mar | Apr | May | Jun | Jul | Aug | Sep | Oct | Nov | Dec |
|---|---|---|---|---|---|---|---|---|---|---|---|---|
| 2004 | 139 | 538 | 509 | 137 | 112 | 27 | 295 | |||||
| 2005 | 65 | 8 | 10 | 5 | 325 | 315 | ||||||
| 2006 | 295 | 313 | 464 | 186 | 269 | 545 | 461 | 170 | 111 | 598 | 405 | |
| 2007 | 268 | 352 | 227 | 163 | 26 | 38 | 459 | 772 | 155 | 98 | 196 | |
| 2008 | 129 | 382 | 4 | 34 | 5 | 329 | 286 | |||||
| 2009 | 303 | 244 | 260 | |||||||||
| 2010 | 621 | 389 | 335 | 468 | 141 | 499 | 92 | 138 | 341 | 286 | ||
| 2011 | 720 | 85 | 340 | 651 | 326 | 170 | 277 | 134 | 457 | 475 | 294 | |
| 2012 | 692 | 629 | 429 | 395 | 219 | 656 | 544 | 419 | 659 | |||
| 2013 | 437 | 499 | 308 | 561 | 539 | 717 | 486 | 349 | ||||
| 2014 | 858 | 711 | 79 | 57 | 278 | 92 | 972 | 134 | 321 | 31 | 790 | |
| 2015 | 663 | 770 | 358 | 822 | 470 | 1,173 | 558 | 280 | 724 | 579 | 566 | |
| 2016 | 281 | 438 | 94 | 667 | 262 | 706 | 443 | 850 | 717 | 285 | ||
| 2017 | 288 | 593 | 619 | 557 | 1,199 | 1,127 | 620 | 1,329 | 280 | 281 | 569 | |
| 2018 | 599 | 686 | 1,041 | 1,624 | 869 | 1,115 | 599 | 569 | 283 | 284 | ||
| 2019 | 840 | 874 | 785 | 1,479 | 600 | 817 | 1,349 | 279 | 437 | 1,411 | ||
| 2020 | 437 | 232 | 54 | 30 | 52 | 100 | 173 | 47 | 29 | |||
| 2021 | 850 | 1,054 | 359 | 785 | 427 | 504 | 598 | 940 | 1,432 | 325 | 263 | |
| 2022 | 826 | 588 | 276 | 576 | 1,115 | 838 | 1,146 | 569 | 1,128 | 568 | ||
| 2023 | 890 | 542 | 1,132 | 1,188 | 1,333 | 558 | 1,095 | 473 | 349 | 318 | ||
| 2024 | 572 | 910 | 650 | 1,311 | 1,025 | 1,140 | ||||||
| - = No Data Reported; -- = Not Applicable; NA = Not Available; W = Withheld to avoid disclosure of individual company data. |
| Release Date: 8/30/2024 |
| Next Release Date: 9/30/2024 |