|
Download Data (XLS File) |
|
||||||||
|
||||||||
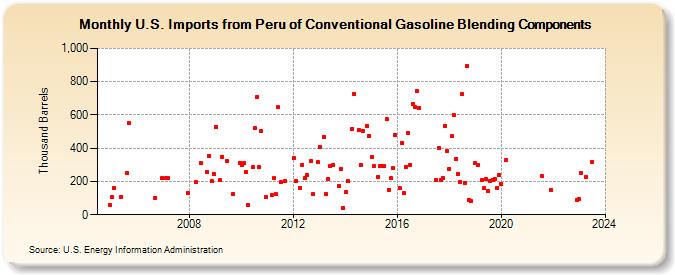
| U.S. Imports from Peru of Conventional Gasoline Blending Components (Thousand Barrels) | ||||||||
| Year | Jan | Feb | Mar | Apr | May | Jun | Jul | Aug | Sep | Oct | Nov | Dec |
|---|---|---|---|---|---|---|---|---|---|---|---|---|
| 2004 | 59 | |||||||||||
| 2005 | 107 | 160 | 104 | 250 | 550 | |||||||
| 2006 | 100 | 219 | ||||||||||
| 2007 | 220 | 220 | 130 | |||||||||
| 2008 | 195 | 308 | 257 | 353 | 200 | 247 | ||||||
| 2009 | 527 | 206 | 348 | 322 | 124 | 310 | ||||||
| 2010 | 299 | 310 | 254 | 61 | 285 | 521 | 708 | 285 | 503 | 105 | ||
| 2011 | 120 | 219 | 124 | 646 | 195 | 200 | ||||||
| 2012 | 338 | 200 | 158 | 299 | 218 | 239 | 323 | 122 | 318 | |||
| 2013 | 409 | 470 | 126 | 217 | 290 | 298 | 172 | 272 | 40 | |||
| 2014 | 138 | 200 | 514 | 728 | 510 | 300 | 506 | 533 | 474 | |||
| 2015 | 348 | 290 | 227 | 290 | 290 | 290 | 573 | 151 | 219 | 280 | 479 | |
| 2016 | 160 | 433 | 129 | 289 | 490 | 300 | 666 | 647 | 742 | 643 | ||
| 2017 | 209 | 404 | 210 | 220 | 533 | 383 | ||||||
| 2018 | 277 | 471 | 601 | 337 | 245 | 198 | 724 | 192 | 896 | 90 | 81 | |
| 2019 | 309 | 301 | 207 | 160 | 213 | 140 | 205 | 210 | 216 | 159 | 237 | |
| 2020 | 186 | 327 | ||||||||||
| 2021 | 230 | 150 | ||||||||||
| 2022 | 90 | |||||||||||
| 2023 | 93 | 251 | 226 | 319 | ||||||||
| - = No Data Reported; -- = Not Applicable; NA = Not Available; W = Withheld to avoid disclosure of individual company data. |
| Release Date: 3/29/2024 |
| Next Release Date: 4/30/2024 |