|
Download Data (XLS File) |
|
||||||||
|
||||||||
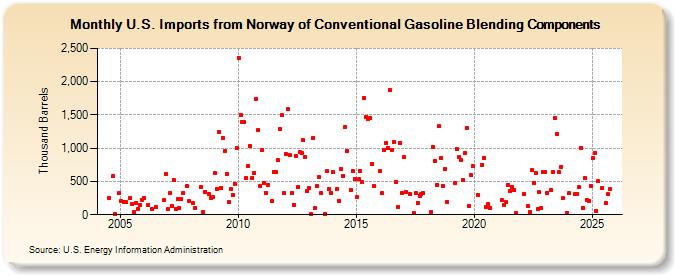
| U.S. Imports from Norway of Conventional Gasoline Blending Components (Thousand Barrels) | ||||||||
| Year | Jan | Feb | Mar | Apr | May | Jun | Jul | Aug | Sep | Oct | Nov | Dec |
|---|---|---|---|---|---|---|---|---|---|---|---|---|
| 2004 | 244 | 576 | 5 | 320 | ||||||||
| 2005 | 201 | 187 | 185 | 249 | 164 | 48 | 182 | 92 | 143 | 225 | ||
| 2006 | 245 | 150 | 81 | 118 | 220 | 617 | ||||||
| 2007 | 91 | 324 | 138 | 525 | 93 | 234 | 100 | 241 | 329 | 431 | 200 | |
| 2008 | 175 | 101 | 418 | 34 | 347 | 318 | 250 | 262 | ||||
| 2009 | 622 | 386 | 1,244 | 405 | 1,158 | 958 | 614 | 189 | 383 | 302 | 469 | 1,006 |
| 2010 | 2,363 | 1,500 | 1,391 | 1,390 | 553 | 727 | 1,026 | 548 | 625 | 1,743 | 1,268 | 432 |
| 2011 | 968 | 473 | 332 | 450 | 202 | 643 | 639 | 822 | 1,293 | 1,493 | 326 | |
| 2012 | 915 | 1,592 | 898 | 330 | 150 | 885 | 415 | 938 | 923 | 1,121 | 873 | 355 |
| 2013 | 403 | 9 | 1,155 | 100 | 436 | 565 | 321 | 16 | 655 | 390 | 327 | |
| 2014 | 641 | 383 | 210 | 690 | 586 | 1,311 | 963 | 375 | 652 | 544 | ||
| 2015 | 260 | 536 | 651 | 486 | 1,754 | 1,473 | 1,437 | 1,453 | 761 | 432 | ||
| 2016 | 653 | 320 | 979 | 1,079 | 1,002 | 1,877 | 969 | 1,098 | 496 | 116 | 1,079 | 331 |
| 2017 | 861 | 340 | 317 | 30 | 322 | 180 | 288 | 305 | 319 | |||
| 2018 | 44 | 1,022 | 808 | 452 | 1,328 | 858 | 434 | 686 | 194 | |||
| 2019 | 478 | 995 | 871 | 824 | 518 | 930 | 1,310 | 127 | 590 | 732 | ||
| 2020 | 296 | 754 | 852 | 116 | 158 | 106 | ||||||
| 2021 | 217 | 148 | 191 | 451 | 354 | 423 | 376 | 19 | ||||
| 2022 | 312 | 125 | 40 | 667 | 476 | 620 | 79 | 336 | 108 | 639 | ||
| 2023 | 644 | 330 | 368 | 642 | 1,452 | 1,215 | 636 | 722 | 245 | 25 | ||
| 2024 | 321 | |||||||||||
| - = No Data Reported; -- = Not Applicable; NA = Not Available; W = Withheld to avoid disclosure of individual company data. |
| Release Date: 3/29/2024 |
| Next Release Date: 4/30/2024 |