|
Download Data (XLS File) |
|
||||||||
|
||||||||
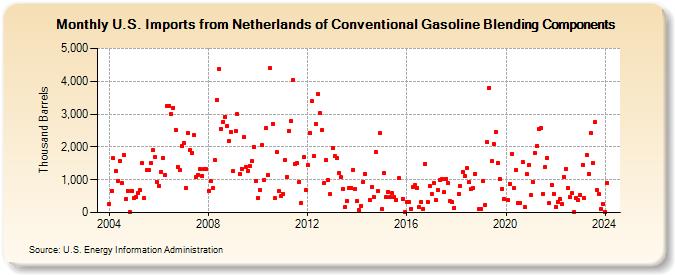
| U.S. Imports from Netherlands of Conventional Gasoline Blending Components (Thousand Barrels) | ||||||||
| Year | Jan | Feb | Mar | Apr | May | Jun | Jul | Aug | Sep | Oct | Nov | Dec |
|---|---|---|---|---|---|---|---|---|---|---|---|---|
| 2004 | 255 | 663 | 1,654 | 1,264 | 966 | 1,566 | 890 | 1,768 | 407 | 667 | 29 | 667 |
| 2005 | 430 | 468 | 603 | 685 | 1,507 | 443 | 1,288 | 1,305 | 1,513 | 1,892 | 1,682 | 926 |
| 2006 | 809 | 1,248 | 1,658 | 1,137 | 3,238 | 3,249 | 3,001 | 3,193 | 2,526 | 1,396 | 1,292 | 2,026 |
| 2007 | 2,117 | 760 | 2,427 | 1,919 | 1,828 | 2,347 | 1,082 | 1,154 | 1,318 | 1,122 | 1,320 | 1,317 |
| 2008 | 659 | 951 | 745 | 1,587 | 3,443 | 4,366 | 2,554 | 2,767 | 2,924 | 2,642 | 2,166 | 2,450 |
| 2009 | 1,261 | 2,480 | 2,999 | 1,171 | 1,341 | 2,308 | 1,392 | 1,274 | 1,433 | 1,560 | 1,998 | 966 |
| 2010 | 448 | 698 | 2,046 | 990 | 2,577 | 1,142 | 4,390 | 2,711 | 435 | 1,843 | 664 | 499 |
| 2011 | 578 | 1,596 | 1,096 | 2,484 | 2,785 | 4,041 | 1,491 | 1,504 | 924 | 301 | 1,690 | 683 |
| 2012 | 1,442 | 2,431 | 3,403 | 1,722 | 2,683 | 3,616 | 3,039 | 2,527 | 903 | 1,603 | 980 | 552 |
| 2013 | 1,981 | 1,720 | 1,673 | 1,201 | 1,072 | 711 | 163 | 346 | 760 | 741 | 1,307 | 731 |
| 2014 | 342 | 69 | 193 | 932 | 1,174 | 396 | 792 | 482 | 1,850 | 654 | 2,410 | |
| 2015 | 99 | 1,191 | 463 | 638 | 460 | 592 | 465 | 396 | 1,042 | 424 | 15 | |
| 2016 | 330 | 324 | 114 | 789 | 833 | 758 | 166 | 335 | 112 | 1,490 | 336 | 815 |
| 2017 | 574 | 915 | 397 | 682 | 993 | 1,017 | 614 | 1,031 | 900 | 341 | 321 | 143 |
| 2018 | 561 | 815 | 1,248 | 1,121 | 1,343 | 928 | 703 | 755 | 1,178 | 100 | ||
| 2019 | 106 | 970 | 233 | 2,139 | 3,802 | 1,559 | 2,090 | 2,462 | 1,513 | 1,016 | 712 | 400 |
| 2020 | 374 | 883 | 1,793 | 737 | 1,296 | 297 | 305 | 1,535 | 169 | 1,169 | 1,442 | |
| 2021 | 549 | 920 | 1,829 | 2,041 | 2,532 | 2,574 | 572 | 1,392 | 1,655 | 285 | 851 | 573 |
| 2022 | 170 | 331 | 410 | 259 | 1,097 | 1,340 | 755 | 472 | 588 | 32 | 450 | 381 |
| 2023 | 546 | 1,449 | 432 | 1,763 | 1,181 | 2,408 | 1,522 | 2,747 | 679 | 560 | 97 | 267 |
| 2024 | 31 | |||||||||||
| - = No Data Reported; -- = Not Applicable; NA = Not Available; W = Withheld to avoid disclosure of individual company data. |
| Release Date: 3/29/2024 |
| Next Release Date: 4/30/2024 |