|
Download Data (XLS File) |
|
||||||||
|
||||||||
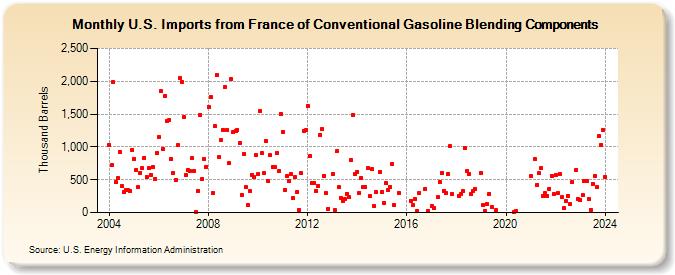
| U.S. Imports from France of Conventional Gasoline Blending Components (Thousand Barrels) | ||||||||
| Year | Jan | Feb | Mar | Apr | May | Jun | Jul | Aug | Sep | Oct | Nov | Dec |
|---|---|---|---|---|---|---|---|---|---|---|---|---|
| 2004 | 1,032 | 719 | 1,982 | 459 | 526 | 927 | 404 | 315 | 346 | 336 | 327 | 960 |
| 2005 | 821 | 651 | 386 | 609 | 675 | 835 | 543 | 672 | 578 | 690 | 516 | 903 |
| 2006 | 1,151 | 1,846 | 971 | 1,781 | 1,391 | 1,413 | 812 | 605 | 494 | 1,023 | 2,044 | 1,992 |
| 2007 | 1,456 | 570 | 646 | 628 | 825 | 638 | 12 | 335 | 1,485 | 512 | 816 | 695 |
| 2008 | 1,608 | 1,760 | 301 | 1,318 | 2,097 | 839 | 1,099 | 1,259 | 1,914 | 1,261 | 751 | 2,032 |
| 2009 | 1,223 | 1,246 | 1,263 | 1,056 | 268 | 896 | 385 | 112 | 324 | 576 | 535 | 872 |
| 2010 | 587 | 1,542 | 900 | 601 | 1,089 | 474 | 872 | 694 | 692 | 905 | 636 | 1,503 |
| 2011 | 1,234 | 348 | 556 | 476 | 588 | 224 | 537 | 314 | 34 | 596 | 1,248 | 1,250 |
| 2012 | 1,627 | 861 | 450 | 456 | 335 | 412 | 1,182 | 1,270 | 563 | 297 | 59 | |
| 2013 | 588 | 33 | 930 | 389 | 227 | 179 | 204 | 287 | 233 | 803 | 1,486 | 586 |
| 2014 | 625 | 299 | 526 | 384 | 389 | 671 | 250 | 657 | 107 | 307 | 614 | |
| 2015 | 320 | 150 | 450 | 343 | 386 | 736 | 114 | 301 | ||||
| 2016 | 181 | 113 | 208 | 25 | 300 | 360 | 24 | |||||
| 2017 | 99 | 65 | 230 | 467 | 599 | 329 | 299 | 589 | 1,007 | 283 | ||
| 2018 | 249 | 280 | 327 | 981 | 627 | 594 | 278 | 324 | 358 | |||
| 2019 | 596 | 111 | 22 | 128 | 289 | 85 | 36 | |||||
| 2020 | 8 | 27 | ||||||||||
| 2021 | 550 | 811 | 427 | 597 | 681 | 250 | 294 | 251 | 364 | 557 | 285 | |
| 2022 | 572 | 295 | 588 | 231 | 62 | 183 | 257 | 124 | 465 | 652 | 206 | |
| 2023 | 188 | 264 | 483 | 487 | 207 | 45 | 441 | 560 | 386 | 1,162 | 1,032 | 1,261 |
| 2024 | 544 | 707 | 464 | 77 | 725 | |||||||
| - = No Data Reported; -- = Not Applicable; NA = Not Available; W = Withheld to avoid disclosure of individual company data. |
| Release Date: 8/30/2024 |
| Next Release Date: 9/30/2024 |