|
Download Data (XLS File) |
|
||||||||
|
||||||||
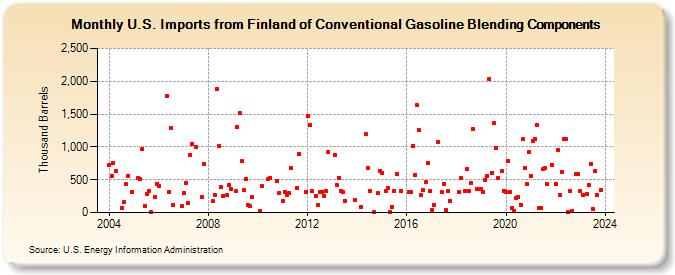
| U.S. Imports from Finland of Conventional Gasoline Blending Components (Thousand Barrels) | ||||||||
| Year | Jan | Feb | Mar | Apr | May | Jun | Jul | Aug | Sep | Oct | Nov | Dec |
|---|---|---|---|---|---|---|---|---|---|---|---|---|
| 2004 | 721 | 560 | 762 | 636 | 75 | 154 | 434 | 562 | 315 | |||
| 2005 | 529 | 516 | 966 | 100 | 277 | 323 | 1 | 236 | 438 | |||
| 2006 | 411 | 1,782 | 315 | 1,288 | 112 | 100 | ||||||
| 2007 | 301 | 454 | 144 | 879 | 1,044 | 1,002 | 230 | 739 | ||||
| 2008 | 172 | 268 | 1,874 | 1,010 | 387 | 254 | 268 | 425 | 354 | |||
| 2009 | 323 | 1,305 | 1,522 | 783 | 338 | 506 | 116 | 98 | 231 | |||
| 2010 | 26 | 403 | 517 | 530 | 473 | 294 | ||||||
| 2011 | 176 | 320 | 263 | 293 | 672 | 374 | 896 | 320 | ||||
| 2012 | 1,470 | 1,333 | 325 | 257 | 115 | 316 | 312 | 259 | 324 | 928 | ||
| 2013 | 870 | 425 | 528 | 332 | 318 | 183 | 192 | |||||
| 2014 | 90 | 1,189 | 680 | 323 | 10 | 295 | 634 | |||||
| 2015 | 604 | 335 | 381 | 10 | 83 | 328 | 589 | 329 | ||||
| 2016 | 312 | 311 | 1,018 | 576 | 1,637 | 1,252 | 272 | 350 | 458 | 755 | 326 | |
| 2017 | 39 | 112 | 1,071 | 310 | 437 | 35 | 323 | 183 | ||||
| 2018 | 315 | 531 | 334 | 666 | 330 | 454 | 1,279 | 354 | ||||
| 2019 | 354 | 312 | 495 | 562 | 2,035 | 601 | 1,369 | 989 | 519 | 628 | 334 | |
| 2020 | 319 | 780 | 312 | 77 | 29 | 215 | 230 | 120 | 1,114 | 686 | 433 | 918 |
| 2021 | 554 | 1,093 | 1,118 | 1,333 | 64 | 62 | 662 | 682 | 429 | 729 | ||
| 2022 | 432 | 952 | 263 | 620 | 1,126 | 1,121 | 8 | 324 | 22 | 593 | 583 | |
| 2023 | 328 | 261 | 289 | 422 | 734 | 55 | 629 | 271 | 339 | |||
| - = No Data Reported; -- = Not Applicable; NA = Not Available; W = Withheld to avoid disclosure of individual company data. |
| Release Date: 3/29/2024 |
| Next Release Date: 4/30/2024 |