|
Download Data (XLS File) |
|
||||||||
|
||||||||
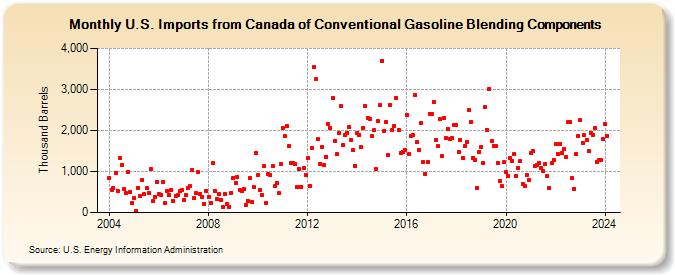
| U.S. Imports from Canada of Conventional Gasoline Blending Components (Thousand Barrels) | ||||||||
| Year | Jan | Feb | Mar | Apr | May | Jun | Jul | Aug | Sep | Oct | Nov | Dec |
|---|---|---|---|---|---|---|---|---|---|---|---|---|
| 2004 | 845 | 560 | 607 | 957 | 533 | 1,330 | 1,154 | 575 | 469 | 977 | 499 | 243 |
| 2005 | 353 | 50 | 605 | 409 | 798 | 455 | 603 | 487 | 1,072 | 281 | 391 | 754 |
| 2006 | 451 | 434 | 741 | 236 | 531 | 424 | 550 | 285 | 414 | 427 | 522 | 539 |
| 2007 | 302 | 434 | 599 | 643 | 1,039 | 359 | 479 | 980 | 456 | 388 | 203 | 526 |
| 2008 | 376 | 234 | 1,205 | 527 | 337 | 452 | 315 | 139 | 456 | 204 | 136 | 480 |
| 2009 | 853 | 722 | 863 | 556 | 525 | 571 | 183 | 291 | 844 | 260 | 616 | 1,449 |
| 2010 | 918 | 555 | 431 | 1,123 | 230 | 928 | 909 | 1,136 | 638 | 720 | 468 | 1,172 |
| 2011 | 2,063 | 1,872 | 2,097 | 1,620 | 1,215 | 1,211 | 1,180 | 634 | 1,050 | 629 | 1,093 | 923 |
| 2012 | 1,329 | 638 | 1,568 | 3,538 | 3,256 | 1,782 | 1,184 | 1,609 | 1,147 | 1,365 | 2,151 | 2,058 |
| 2013 | 2,794 | 1,755 | 1,426 | 1,949 | 2,587 | 1,643 | 1,887 | 1,945 | 2,075 | 1,774 | 1,514 | 1,139 |
| 2014 | 1,950 | 1,900 | 1,604 | 2,070 | 2,587 | 2,316 | 2,285 | 1,877 | 2,004 | 1,056 | 2,224 | 2,618 |
| 2015 | 3,703 | 1,993 | 2,217 | 1,397 | 2,627 | 2,022 | 2,119 | 2,801 | 2,002 | 1,461 | 1,472 | 1,525 |
| 2016 | 2,388 | 1,432 | 1,874 | 1,885 | 2,868 | 1,710 | 1,514 | 2,187 | 1,226 | 946 | 1,235 | 2,408 |
| 2017 | 2,410 | 2,704 | 1,756 | 1,615 | 2,276 | 1,377 | 2,313 | 1,809 | 2,037 | 1,796 | 1,810 | 2,130 |
| 2018 | 2,124 | 1,478 | 1,776 | 1,331 | 1,618 | 1,708 | 2,489 | 2,207 | 1,319 | 1,286 | 603 | 1,487 |
| 2019 | 1,597 | 1,211 | 2,567 | 2,011 | 3,020 | 1,744 | 1,630 | 1,618 | 1,214 | 771 | 637 | 1,220 |
| 2020 | 982 | 883 | 1,332 | 1,246 | 1,431 | 887 | 1,082 | 1,248 | 699 | 654 | 920 | 784 |
| 2021 | 1,440 | 1,492 | 1,143 | 1,167 | 1,196 | 1,091 | 1,002 | 1,178 | 891 | 593 | 1,196 | 1,290 |
| 2022 | 1,662 | 1,428 | 1,673 | 1,457 | 1,550 | 1,353 | 2,201 | 2,197 | 854 | 583 | 1,433 | 1,855 |
| 2023 | 2,247 | 1,700 | 1,889 | 1,770 | 1,502 | 1,945 | 1,888 | 2,067 | 1,236 | 1,272 | 1,275 | 1,786 |
| 2024 | 2,151 | |||||||||||
| - = No Data Reported; -- = Not Applicable; NA = Not Available; W = Withheld to avoid disclosure of individual company data. |
| Release Date: 3/29/2024 |
| Next Release Date: 4/30/2024 |