|
Download Data (XLS File) |
|
||||||||
|
||||||||
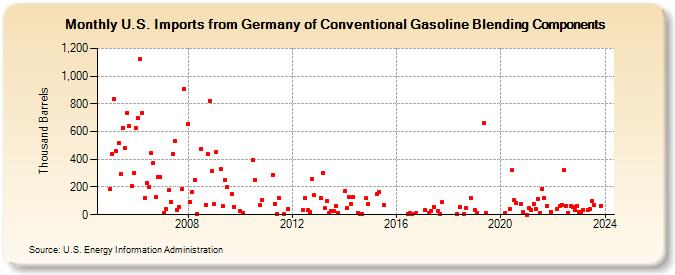
| U.S. Imports from Germany of Conventional Gasoline Blending Components (Thousand Barrels) | ||||||||
| Year | Jan | Feb | Mar | Apr | May | Jun | Jul | Aug | Sep | Oct | Nov | Dec |
|---|---|---|---|---|---|---|---|---|---|---|---|---|
| 2005 | 185 | 437 | 835 | 459 | 521 | 295 | 629 | 482 | 737 | 639 | 207 | 300 |
| 2006 | 624 | 697 | 1,124 | 736 | 122 | 230 | 200 | 442 | 373 | 125 | 271 | 272 |
| 2007 | 14 | 39 | 178 | 95 | 439 | 531 | 35 | 58 | 182 | 907 | ||
| 2008 | 651 | 92 | 164 | 251 | 7 | 477 | 71 | 441 | 824 | 312 | ||
| 2009 | 74 | 454 | 327 | 60 | 247 | 199 | 151 | 58 | ||||
| 2010 | 25 | 9 | 396 | 250 | 67 | 107 | ||||||
| 2011 | 288 | 80 | 8 | 123 | 6 | 42 | ||||||
| 2012 | 34 | 121 | 34 | 18 | 258 | 140 | ||||||
| 2013 | 124 | 304 | 46 | 102 | 10 | 26 | 25 | 61 | 14 | |||
| 2014 | 169 | 47 | 125 | 74 | 126 | 13 | 7 | 3 | 118 | 78 | ||
| 2015 | 151 | 162 | 69 | |||||||||
| 2016 | 7 | 9 | 3 | 13 | ||||||||
| 2017 | 32 | 9 | 25 | 56 | 24 | 8 | 91 | |||||
| 2018 | 5 | 57 | 4 | 51 | 119 | |||||||
| 2019 | 35 | 15 | 660 | 10 | ||||||||
| 2020 | 14 | 41 | 321 | 103 | 84 | 80 | 16 | |||||
| 2021 | 1 | 49 | 31 | 78 | 44 | 115 | 15 | 189 | 117 | 62 | 22 | |
| 2022 | 43 | 62 | 73 | 324 | 65 | 11 | 62 | 55 | 33 | 63 | ||
| 2023 | 21 | 22 | 37 | 33 | 38 | 102 | 73 | 63 | ||||
| - = No Data Reported; -- = Not Applicable; NA = Not Available; W = Withheld to avoid disclosure of individual company data. |
| Release Date: 3/29/2024 |
| Next Release Date: 4/30/2024 |