|
Download Data (XLS File) |
|
||||||||
|
||||||||
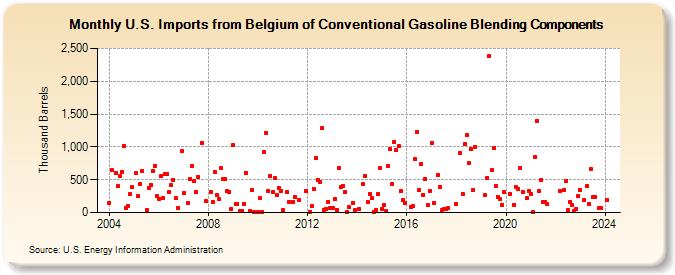
| U.S. Imports from Belgium of Conventional Gasoline Blending Components (Thousand Barrels) | ||||||||
| Year | Jan | Feb | Mar | Apr | May | Jun | Jul | Aug | Sep | Oct | Nov | Dec |
|---|---|---|---|---|---|---|---|---|---|---|---|---|
| 2004 | 150 | 647 | 609 | 401 | 554 | 624 | 1,018 | 71 | 102 | 276 | 389 | |
| 2005 | 596 | 245 | 430 | 636 | 46 | 373 | 424 | 635 | 712 | 246 | ||
| 2006 | 209 | 558 | 219 | 590 | 589 | 309 | 415 | 492 | 227 | 71 | 935 | |
| 2007 | 304 | 141 | 508 | 715 | 474 | 314 | 546 | 1,065 | 171 | |||
| 2008 | 318 | 167 | 622 | 268 | 199 | 685 | 517 | 509 | 321 | 315 | 58 | |
| 2009 | 1,027 | 128 | 131 | 20 | 22 | 134 | 609 | 22 | 343 | 5 | ||
| 2010 | 9 | 215 | 4 | 928 | 1,215 | 328 | 563 | 314 | 531 | 260 | 373 | 326 |
| 2011 | 36 | 319 | 162 | 162 | 239 | 198 | 327 | |||||
| 2012 | 8 | 98 | 358 | 828 | 503 | 465 | 1,291 | 43 | 47 | 167 | 71 | |
| 2013 | 69 | 199 | 36 | 672 | 388 | 408 | 308 | 6 | 91 | 151 | 33 | |
| 2014 | 52 | 433 | 555 | 167 | 283 | 215 | 9 | 44 | 286 | 682 | ||
| 2015 | 59 | 110 | 31 | 706 | 962 | 431 | 1,076 | 946 | 1,011 | 331 | 187 | 147 |
| 2016 | 86 | 98 | 815 | 1,224 | 347 | 743 | 274 | 507 | 110 | 326 | ||
| 2017 | 1,053 | 149 | 579 | 393 | 42 | 48 | 52 | 72 | ||||
| 2018 | 130 | 902 | 284 | 1,043 | 1,179 | 748 | 969 | 346 | 1,003 | |||
| 2019 | 260 | 529 | 2,379 | 644 | 979 | 411 | 243 | 205 | 120 | 317 | ||
| 2020 | 289 | 121 | 389 | 364 | 683 | 316 | 221 | 328 | ||||
| 2021 | 285 | 13 | 852 | 1,397 | 328 | 497 | 159 | 161 | 123 | |||
| 2022 | 324 | 347 | 474 | 36 | 162 | 111 | 26 | 58 | 249 | |||
| 2023 | 340 | 190 | 401 | 124 | 661 | 236 | 240 | 65 | 72 | |||
| - = No Data Reported; -- = Not Applicable; NA = Not Available; W = Withheld to avoid disclosure of individual company data. |
| Release Date: 3/29/2024 |
| Next Release Date: 4/30/2024 |