|
Download Data (XLS File) |
|
||||||||
|
||||||||
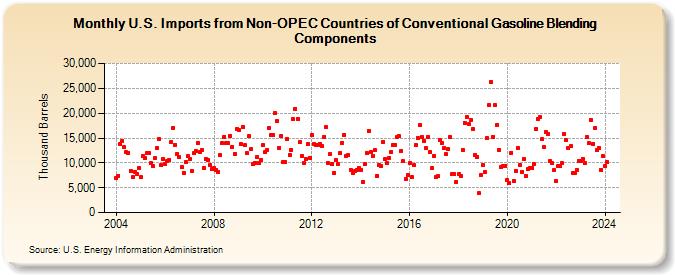
| U.S. Imports from Non-OPEC Countries of Conventional Gasoline Blending Components (Thousand Barrels) | ||||||||
| Year | Jan | Feb | Mar | Apr | May | Jun | Jul | Aug | Sep | Oct | Nov | Dec |
|---|---|---|---|---|---|---|---|---|---|---|---|---|
| 2004 | 6,910 | 7,441 | 13,846 | 14,405 | 13,118 | 12,136 | 12,037 | 8,314 | 7,135 | 8,132 | 7,821 | 9,017 |
| 2005 | 7,101 | 11,453 | 10,997 | 11,923 | 11,906 | 9,915 | 9,353 | 10,910 | 12,972 | 14,762 | 9,563 | 10,877 |
| 2006 | 9,823 | 10,373 | 10,651 | 14,193 | 17,097 | 13,681 | 11,796 | 11,096 | 9,125 | 8,005 | 10,106 | 11,389 |
| 2007 | 10,702 | 8,364 | 11,914 | 12,396 | 14,084 | 12,183 | 12,627 | 9,067 | 10,762 | 10,625 | 9,564 | 8,684 |
| 2008 | 8,979 | 8,608 | 8,164 | 11,539 | 13,981 | 15,263 | 13,964 | 13,963 | 15,406 | 13,291 | 11,856 | 16,848 |
| 2009 | 16,654 | 13,699 | 17,313 | 13,542 | 11,886 | 15,354 | 12,697 | 9,801 | 10,034 | 11,165 | 9,924 | 10,598 |
| 2010 | 13,567 | 12,108 | 12,676 | 17,077 | 15,679 | 15,535 | 19,957 | 18,360 | 12,998 | 15,467 | 10,244 | 10,181 |
| 2011 | 14,768 | 11,591 | 12,661 | 18,747 | 20,917 | 18,890 | 14,139 | 11,418 | 9,917 | 10,815 | 13,753 | 10,999 |
| 2012 | 15,590 | 13,801 | 13,579 | 13,640 | 13,846 | 13,377 | 15,275 | 17,138 | 10,002 | 11,739 | 9,746 | 7,940 |
| 2013 | 10,552 | 9,673 | 11,923 | 14,011 | 15,668 | 11,447 | 11,501 | 8,662 | 7,936 | 8,337 | 8,571 | 8,964 |
| 2014 | 8,555 | 6,150 | 9,818 | 11,998 | 16,420 | 12,206 | 11,439 | 12,493 | 7,412 | 9,663 | 9,393 | 14,275 |
| 2015 | 10,859 | 9,884 | 11,065 | 12,173 | 13,685 | 13,580 | 15,242 | 15,320 | 12,459 | 10,292 | 6,759 | 7,484 |
| 2016 | 9,945 | 7,089 | 9,492 | 13,592 | 15,052 | 17,608 | 15,205 | 14,496 | 12,982 | 15,218 | 12,212 | 8,907 |
| 2017 | 11,443 | 7,143 | 7,294 | 14,573 | 14,060 | 13,089 | 11,715 | 12,833 | 15,107 | 7,765 | 7,772 | 6,240 |
| 2018 | 7,720 | 7,281 | 12,655 | 18,064 | 19,251 | 17,730 | 18,626 | 16,812 | 11,492 | 11,089 | 3,849 | 7,513 |
| 2019 | 9,492 | 8,084 | 14,987 | 21,685 | 26,230 | 15,262 | 21,588 | 17,671 | 12,543 | 9,242 | 9,276 | 9,467 |
| 2020 | 6,595 | 5,876 | 12,052 | 6,306 | 8,428 | 13,032 | 9,656 | 8,142 | 10,737 | 7,454 | 8,750 | 8,983 |
| 2021 | 9,027 | 9,732 | 16,775 | 18,891 | 19,219 | 14,725 | 13,130 | 16,120 | 15,882 | 10,317 | 9,885 | 8,474 |
| 2022 | 6,290 | 9,339 | 9,316 | 9,892 | 15,787 | 14,583 | 12,914 | 13,298 | 8,040 | 7,977 | 8,636 | 10,383 |
| 2023 | 10,463 | 10,854 | 9,905 | 15,119 | 13,961 | 18,728 | 13,871 | 17,116 | 12,546 | 13,068 | 8,684 | 11,438 |
| 2024 | 9,353 | 10,147 | 10,603 | 14,973 | 13,972 | 16,961 | ||||||
| - = No Data Reported; -- = Not Applicable; NA = Not Available; W = Withheld to avoid disclosure of individual company data. |
| Release Date: 8/30/2024 |
| Next Release Date: 9/30/2024 |