|
Download Data (XLS File) |
|
||||||||
|
||||||||
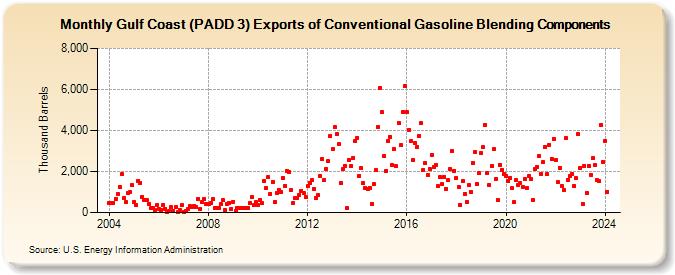
| Gulf Coast (PADD 3) Exports of Conventional Gasoline Blending Components (Thousand Barrels) | ||||||||
| Year | Jan | Feb | Mar | Apr | May | Jun | Jul | Aug | Sep | Oct | Nov | Dec |
|---|---|---|---|---|---|---|---|---|---|---|---|---|
| 2004 | 476 | 447 | 469 | 662 | 908 | 1,239 | 1,870 | 700 | 504 | 947 | 982 | 1,346 |
| 2005 | 519 | 346 | 1,560 | 1,446 | 754 | 618 | 630 | 420 | 204 | 230 | 109 | 389 |
| 2006 | 181 | 143 | 369 | 183 | 26 | 66 | 258 | 83 | 269 | 22 | 137 | 346 |
| 2007 | 43 | 68 | 178 | 305 | 247 | 337 | 274 | 669 | 154 | 522 | 638 | 394 |
| 2008 | 427 | 474 | 646 | 229 | 243 | 229 | 393 | 595 | 122 | 407 | 461 | 193 |
| 2009 | 532 | 78 | 199 | 217 | 205 | 228 | 213 | 230 | 448 | 748 | 350 | 493 |
| 2010 | 351 | 631 | 447 | 1,515 | 1,193 | 1,738 | 922 | 1,504 | 503 | 961 | 1,102 | 985 |
| 2011 | 1,690 | 1,316 | 2,045 | 1,991 | 1,081 | 486 | 686 | 730 | 872 | 1,066 | 953 | 766 |
| 2012 | 1,293 | 1,454 | 1,565 | 1,149 | 719 | 844 | 1,769 | 2,618 | 1,571 | 2,132 | 2,494 | 3,723 |
| 2013 | 3,083 | 4,149 | 3,823 | 3,318 | 1,433 | 2,119 | 2,289 | 208 | 2,574 | 2,274 | 2,674 | 3,508 |
| 2014 | 3,655 | 1,804 | 2,159 | 1,425 | 1,206 | 1,171 | 1,196 | 431 | 1,376 | 2,071 | 4,176 | 6,077 |
| 2015 | 4,883 | 2,752 | 2,026 | 3,510 | 3,698 | 2,312 | 3,102 | 2,250 | 4,384 | 3,288 | 4,904 | 6,144 |
| 2016 | 4,891 | 4,024 | 3,493 | 2,539 | 3,396 | 3,215 | 3,755 | 4,363 | 2,077 | 2,406 | 1,832 | 2,134 |
| 2017 | 2,818 | 2,212 | 2,311 | 1,271 | 1,717 | 1,373 | 1,748 | 1,152 | 1,565 | 2,102 | 2,980 | 2,032 |
| 2018 | 1,675 | 1,269 | 383 | 1,514 | 914 | 509 | 1,326 | 1,025 | 2,415 | 2,947 | 1,403 | 1,926 |
| 2019 | 2,886 | 3,173 | 4,282 | 1,947 | 1,349 | 2,257 | 3,080 | 1,658 | 634 | 2,338 | 2,097 | 1,896 |
| 2020 | 1,788 | 1,549 | 1,708 | 1,182 | 507 | 1,578 | 1,333 | 1,444 | 1,227 | 1,643 | 1,190 | 1,769 |
| 2021 | 1,626 | 625 | 2,142 | 2,231 | 2,740 | 1,890 | 2,461 | 3,185 | 1,858 | 3,297 | 2,610 | 3,607 |
| 2022 | 2,542 | 1,465 | 2,184 | 1,310 | 1,092 | 3,624 | 1,587 | 1,761 | 1,869 | 1,308 | 1,663 | 3,813 |
| 2023 | 2,174 | 427 | 2,282 | 955 | 2,284 | 1,840 | 2,651 | 2,306 | 1,597 | 1,523 | 4,273 | 2,467 |
| 2024 | 3,503 | |||||||||||
| - = No Data Reported; -- = Not Applicable; NA = Not Available; W = Withheld to avoid disclosure of individual company data. |
| Release Date: 3/29/2024 |
| Next Release Date: 4/30/2024 |