|
Download Data (XLS File) |
|
||||||||
|
||||||||
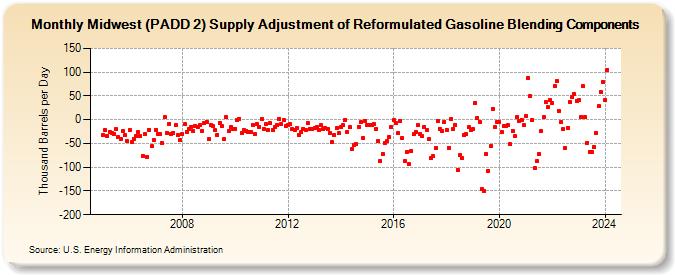
| Midwest (PADD 2) Supply Adjustment of Reformulated Gasoline Blending Components (Thousand Barrels per Day) | ||||||||
| Year | Jan | Feb | Mar | Apr | May | Jun | Jul | Aug | Sep | Oct | Nov | Dec |
|---|---|---|---|---|---|---|---|---|---|---|---|---|
| 2005 | -33 | -22 | -34 | -26 | -27 | -31 | -20 | -37 | -40 | -24 | -33 | -45 |
| 2006 | -22 | -48 | -40 | -34 | -26 | -35 | -77 | -31 | -78 | -21 | -56 | -42 |
| 2007 | -21 | -30 | -30 | -49 | 5 | -28 | -9 | -30 | -27 | -12 | -33 | -43 |
| 2008 | -30 | -10 | -25 | -19 | -15 | -24 | -13 | -15 | -12 | -23 | -6 | -4 |
| 2009 | -41 | -11 | -14 | -22 | -32 | -6 | -14 | -41 | 5 | -24 | -16 | -19 |
| 2010 | -19 | -1 | 2 | -27 | -22 | -23 | -25 | -26 | -11 | -31 | -10 | -15 |
| 2011 | 2 | -19 | -10 | -22 | -8 | -21 | -16 | -11 | 2 | -10 | -1 | -14 |
| 2012 | -12 | -10 | -20 | -22 | -18 | -33 | -26 | -19 | -22 | -8 | -19 | -19 |
| 2013 | -18 | -15 | -21 | -12 | -20 | -18 | -19 | -27 | -48 | -32 | -18 | -28 |
| 2014 | -15 | -12 | 0 | -25 | -16 | -62 | -54 | -51 | -15 | -5 | -39 | -2 |
| 2015 | -12 | -11 | -11 | -10 | -19 | -45 | -87 | -72 | -49 | -45 | -36 | -15 |
| 2016 | -1 | -6 | -28 | -2 | -39 | -88 | -68 | -94 | -65 | -31 | -25 | -12 |
| 2017 | -30 | -35 | -15 | -22 | -41 | -80 | -77 | -60 | -3 | -19 | -23 | -4 |
| 2018 | -21 | -59 | 1 | -19 | -11 | -105 | -75 | -81 | -33 | -31 | -16 | -21 |
| 2019 | -20 | 36 | 4 | -4 | -146 | -150 | -72 | -108 | -56 | 23 | -16 | -5 |
| 2020 | -5 | -26 | -13 | -13 | -12 | -52 | -23 | -35 | 6 | -3 | 0 | -11 |
| 2021 | 8 | 88 | 49 | -1 | -102 | -87 | -72 | -24 | 6 | 37 | 26 | 42 |
| 2022 | 35 | 71 | 81 | 19 | -5 | -20 | -60 | -17 | 38 | 47 | 54 | 40 |
| 2023 | 41 | 6 | 70 | 5 | -49 | -67 | -68 | -57 | -28 | 28 | 59 | 79 |
| 2024 | 41 | |||||||||||
| - = No Data Reported; -- = Not Applicable; NA = Not Available; W = Withheld to avoid disclosure of individual company data. |
| Release Date: 3/29/2024 |
| Next Release Date: 4/30/2024 |