|
Download Data (XLS File) |
|
||||||||
|
||||||||
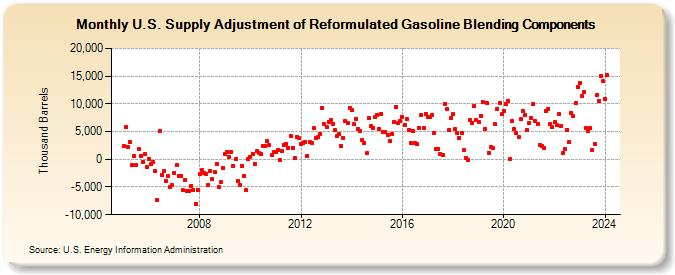
| U.S. Supply Adjustment of Reformulated Gasoline Blending Components (Thousand Barrels) | ||||||||
| Year | Jan | Feb | Mar | Apr | May | Jun | Jul | Aug | Sep | Oct | Nov | Dec |
|---|---|---|---|---|---|---|---|---|---|---|---|---|
| 2005 | 2,341 | 5,865 | 2,226 | 3,131 | -1,063 | 586 | -1,071 | 1,780 | 666 | -414 | 1,022 | -1,440 |
| 2006 | 98 | -939 | -519 | -2,170 | -7,395 | 5,074 | -2,788 | -2,195 | -3,898 | -3,060 | -5,038 | -4,713 |
| 2007 | -2,400 | -1,068 | -2,968 | -2,974 | -5,528 | -3,675 | -5,744 | -5,800 | -4,776 | -5,628 | -8,008 | -5,529 |
| 2008 | -2,646 | -1,954 | -2,536 | -2,590 | -4,564 | -2,200 | -3,621 | -2,303 | -819 | -5,030 | -4,170 | -1,545 |
| 2009 | 987 | 1,386 | 420 | 1,315 | -1,209 | 47 | -3,892 | -4,576 | -1,163 | -3,028 | -5,574 | 36 |
| 2010 | 368 | 1,013 | -773 | 1,405 | 1,049 | 942 | 2,315 | 2,313 | 3,277 | 2,489 | 812 | 1,249 |
| 2011 | 1,328 | 1,697 | -66 | 1,445 | 2,657 | 2,804 | 2,033 | 4,214 | 2,095 | 288 | 3,930 | 3,763 |
| 2012 | 2,749 | 2,868 | 3,142 | 599 | 3,128 | 2,875 | 5,569 | 3,842 | 3,940 | 4,520 | 9,297 | 6,365 |
| 2013 | 5,890 | 6,813 | 7,089 | 6,388 | 5,202 | 4,136 | 4,548 | 2,365 | 3,923 | 6,869 | 6,618 | 9,317 |
| 2014 | 8,882 | 6,281 | 7,246 | 5,503 | 5,010 | 3,509 | 2,904 | 1,046 | 7,434 | 6,025 | 5,631 | 7,637 |
| 2015 | 8,024 | 5,527 | 8,247 | 4,834 | 4,914 | 4,338 | 3,283 | 4,542 | 6,769 | 9,465 | 6,505 | 6,870 |
| 2016 | 7,581 | 6,250 | 7,178 | 5,355 | 2,926 | 5,126 | 2,921 | 2,695 | 5,695 | 7,977 | 5,623 | 8,172 |
| 2017 | 7,551 | 7,640 | 8,060 | 4,802 | 1,883 | 1,865 | 906 | 764 | 10,017 | 9,028 | 5,206 | 7,427 |
| 2018 | 8,147 | 5,385 | 4,732 | 3,917 | 4,704 | 1,632 | 185 | -47 | 7,028 | 6,495 | 9,644 | 7,127 |
| 2019 | 6,772 | 7,829 | 10,352 | 5,541 | 10,133 | 1,220 | 2,301 | 2,015 | 6,308 | 9,109 | 10,191 | 8,109 |
| 2020 | 8,621 | 10,030 | 10,584 | 14 | 6,967 | 5,431 | 4,822 | 3,942 | 7,180 | 8,741 | 7,981 | 5,347 |
| 2021 | 6,532 | 7,446 | 9,889 | 6,902 | 6,285 | 2,645 | 2,479 | 2,010 | 8,670 | 9,149 | 6,274 | 5,805 |
| 2022 | 6,663 | 6,190 | 8,128 | 5,991 | 1,083 | 1,852 | 5,341 | 3,061 | 8,394 | 7,846 | 10,159 | 13,111 |
| 2023 | 13,728 | 11,328 | 12,120 | 5,575 | 5,141 | 5,584 | 1,607 | 2,797 | 11,594 | 10,501 | 14,996 | 14,087 |
| 2024 | 10,889 | |||||||||||
| - = No Data Reported; -- = Not Applicable; NA = Not Available; W = Withheld to avoid disclosure of individual company data. |
| Release Date: 3/29/2024 |
| Next Release Date: 4/30/2024 |