|
Download Data (XLS File) |
|
||||||||
|
||||||||
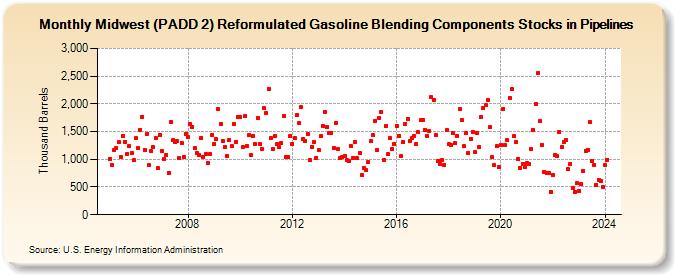
| Midwest (PADD 2) Reformulated Gasoline Blending Components Stocks in Pipelines (Thousand Barrels) | ||||||||
| Year | Jan | Feb | Mar | Apr | May | Jun | Jul | Aug | Sep | Oct | Nov | Dec |
|---|---|---|---|---|---|---|---|---|---|---|---|---|
| 2005 | 1,009 | 899 | 1,160 | 1,199 | 1,306 | 1,040 | 1,417 | 1,318 | 1,101 | 1,234 | 1,110 | 982 |
| 2006 | 1,375 | 1,201 | 1,537 | 1,764 | 1,173 | 1,461 | 892 | 1,148 | 1,214 | 1,382 | 840 | 1,445 |
| 2007 | 1,144 | 1,007 | 1,080 | 760 | 1,681 | 1,339 | 1,311 | 1,328 | 1,016 | 1,302 | 1,047 | 1,463 |
| 2008 | 1,396 | 1,629 | 1,584 | 1,206 | 1,121 | 1,086 | 1,383 | 1,048 | 1,100 | 928 | 1,095 | 1,443 |
| 2009 | 1,282 | 1,359 | 1,906 | 1,643 | 1,332 | 1,224 | 1,060 | 1,348 | 1,234 | 1,644 | 1,318 | 1,769 |
| 2010 | 1,765 | 1,215 | 1,775 | 1,237 | 1,436 | 1,071 | 1,424 | 1,278 | 1,753 | 1,280 | 1,186 | 1,917 |
| 2011 | 1,839 | 2,273 | 1,376 | 1,186 | 1,414 | 1,273 | 1,221 | 1,295 | 1,776 | 1,040 | 1,037 | 1,411 |
| 2012 | 1,280 | 1,381 | 1,790 | 1,648 | 1,941 | 1,360 | 1,335 | 1,461 | 984 | 1,227 | 1,308 | 1,031 |
| 2013 | 1,166 | 1,412 | 1,609 | 1,858 | 1,582 | 1,482 | 1,473 | 1,204 | 1,663 | 1,179 | 1,017 | 1,038 |
| 2014 | 1,062 | 984 | 964 | 1,238 | 1,021 | 1,311 | 1,014 | 1,112 | 718 | 850 | 801 | 954 |
| 2015 | 1,330 | 1,432 | 1,698 | 1,169 | 1,748 | 1,849 | 983 | 1,603 | 1,093 | 1,378 | 1,189 | 1,277 |
| 2016 | 1,597 | 1,422 | 1,053 | 1,315 | 1,643 | 1,722 | 1,328 | 1,381 | 1,421 | 1,269 | 1,489 | 1,703 |
| 2017 | 1,712 | 1,533 | 1,428 | 1,511 | 2,115 | 2,077 | 1,434 | 966 | 906 | 980 | 903 | 1,525 |
| 2018 | 1,270 | 1,257 | 1,469 | 1,290 | 1,419 | 1,902 | 1,713 | 1,232 | 1,477 | 1,110 | 1,372 | 1,500 |
| 2019 | 1,126 | 1,479 | 1,224 | 1,758 | 1,920 | 1,977 | 2,065 | 1,577 | 1,036 | 892 | 1,233 | 855 |
| 2020 | 1,263 | 1,913 | 1,261 | 1,341 | 2,113 | 2,264 | 1,412 | 1,314 | 1,003 | 846 | 921 | 868 |
| 2021 | 924 | 908 | 1,185 | 1,528 | 1,995 | 2,553 | 1,682 | 1,266 | 771 | 746 | 759 | 415 |
| 2022 | 712 | 1,075 | 1,061 | 1,498 | 1,230 | 1,309 | 1,344 | 816 | 916 | 483 | 417 | 567 |
| 2023 | 430 | 549 | 786 | 1,154 | 1,176 | 1,674 | 970 | 899 | 543 | 630 | 607 | 508 |
| 2024 | 891 | |||||||||||
| - = No Data Reported; -- = Not Applicable; NA = Not Available; W = Withheld to avoid disclosure of individual company data. |
| Release Date: 3/29/2024 |
| Next Release Date: 4/30/2024 |