|
Download Data (XLS File) |
|
||||||||
|
||||||||
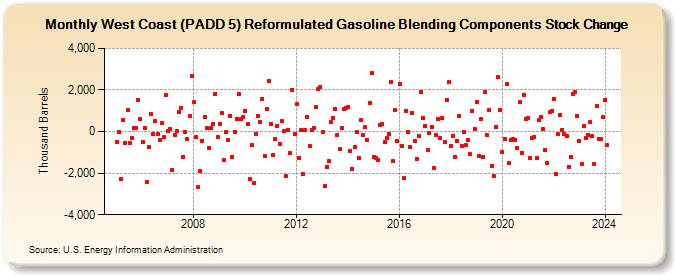
| West Coast (PADD 5) Reformulated Gasoline Blending Components Stock Change (Thousand Barrels) | ||||||||
| Year | Jan | Feb | Mar | Apr | May | Jun | Jul | Aug | Sep | Oct | Nov | Dec |
|---|---|---|---|---|---|---|---|---|---|---|---|---|
| 2005 | -498 | -45 | -2,268 | 553 | -543 | 1,015 | -552 | -301 | 193 | 148 | 1,541 | 596 |
| 2006 | -479 | 149 | -2,448 | -760 | 834 | -106 | 529 | -132 | -388 | 393 | -280 | 1,765 |
| 2007 | 7 | 111 | -1,835 | -158 | 13 | 925 | 1,122 | -1,229 | -2 | -378 | 734 | 2,696 |
| 2008 | 1,408 | -260 | -2,643 | -1,908 | -435 | 714 | 147 | -807 | 157 | 355 | 1,830 | -264 |
| 2009 | 348 | 893 | -1,390 | -43 | -420 | 753 | -1,217 | -8 | 626 | 1,796 | 599 | 687 |
| 2010 | 983 | 344 | -2,305 | -638 | -2,474 | -123 | 770 | 450 | 1,583 | -1,158 | 1,079 | 2,420 |
| 2011 | 358 | -1,111 | -375 | 273 | -581 | 496 | 36 | -2,139 | 84 | -1,024 | 2,013 | -135 |
| 2012 | 1,321 | -1,266 | 51 | -2,064 | 61 | 699 | -704 | 92 | 175 | 1,184 | 2,045 | 2,122 |
| 2013 | -43 | -2,623 | -1,717 | -1,439 | 481 | 647 | 1,071 | -176 | -840 | 180 | 1,099 | 1,131 |
| 2014 | 1,160 | -938 | -1,799 | -739 | -13 | -1,272 | 561 | -162 | 207 | -386 | 1,383 | 2,807 |
| 2015 | -1,206 | -1,258 | -1,364 | 321 | 367 | -487 | -334 | -115 | 2,376 | -1,409 | 1,023 | -473 |
| 2016 | 2,284 | -678 | -2,219 | 994 | -12 | -735 | 905 | -467 | -1,300 | -205 | 1,881 | 662 |
| 2017 | 275 | -886 | -46 | 218 | -1,766 | -185 | 584 | -305 | 663 | -492 | 1,528 | 2,377 |
| 2018 | -692 | -199 | -1,226 | -437 | 770 | -689 | -19 | -656 | -417 | -1,081 | 989 | 132 |
| 2019 | 1,426 | -1,188 | 587 | -1,218 | 1,886 | -180 | 1,025 | -1,637 | -2,122 | 197 | 2,613 | 1,014 |
| 2020 | -973 | -356 | 2,297 | -1,535 | -409 | -345 | -395 | -792 | 1,398 | -1,015 | 1,780 | 588 |
| 2021 | 637 | -1,280 | -312 | -264 | -1,257 | 538 | 700 | 112 | -892 | -1,491 | 925 | 1,006 |
| 2022 | 1,579 | -2,055 | -121 | 795 | 92 | -131 | -208 | -1,685 | -1,204 | 1,817 | 1,889 | 754 |
| 2023 | -439 | -1,543 | 263 | -287 | -162 | 438 | -192 | -1,550 | 1,250 | -356 | -336 | 686 |
| 2024 | 1,536 | |||||||||||
| - = No Data Reported; -- = Not Applicable; NA = Not Available; W = Withheld to avoid disclosure of individual company data. |
| Release Date: 3/29/2024 |
| Next Release Date: 4/30/2024 |