|
Download Data (XLS File) |
|
||||||||
|
||||||||
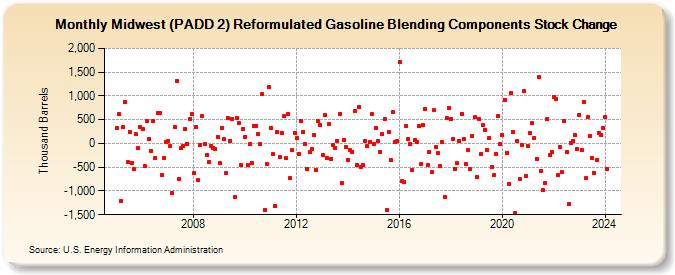
| Midwest (PADD 2) Reformulated Gasoline Blending Components Stock Change (Thousand Barrels) | ||||||||
| Year | Jan | Feb | Mar | Apr | May | Jun | Jul | Aug | Sep | Oct | Nov | Dec |
|---|---|---|---|---|---|---|---|---|---|---|---|---|
| 2005 | 330 | 618 | -1,201 | 339 | 865 | -394 | 250 | -421 | -539 | 193 | -92 | 344 |
| 2006 | 299 | -479 | 476 | 88 | -149 | 473 | -297 | 642 | 636 | -659 | -299 | 37 |
| 2007 | 49 | -56 | -1,048 | 356 | 1,324 | -741 | -106 | -46 | 294 | -11 | 510 | 609 |
| 2008 | -621 | 348 | -768 | -37 | 567 | -20 | -241 | -396 | -51 | -96 | -127 | 143 |
| 2009 | -418 | 334 | 85 | -628 | 531 | 61 | 516 | -1,130 | 538 | 435 | -461 | 309 |
| 2010 | 144 | -458 | -17 | -406 | 364 | 368 | 202 | -13 | 1,044 | -1,399 | -426 | 1,180 |
| 2011 | 328 | -224 | -1,308 | 241 | -294 | 218 | 567 | -314 | 627 | -729 | -148 | 225 |
| 2012 | 111 | -216 | 481 | 248 | -16 | -534 | -183 | -114 | 175 | -560 | 469 | 391 |
| 2013 | -248 | 596 | -312 | 408 | -324 | -31 | -96 | 57 | 628 | -823 | 70 | -68 |
| 2014 | -341 | -135 | -175 | 686 | -455 | 765 | -491 | -452 | 52 | -58 | 31 | 613 |
| 2015 | -14 | 332 | 56 | -173 | 193 | 512 | -1,391 | 245 | -354 | 654 | 36 | 44 |
| 2016 | 1,719 | -799 | -812 | 368 | 96 | -13 | -564 | 64 | 32 | 363 | -423 | 386 |
| 2017 | 730 | -456 | -171 | -604 | 695 | -83 | -204 | -467 | 20 | -1,117 | 530 | 744 |
| 2018 | 517 | 98 | -539 | -419 | 47 | 627 | 101 | -438 | -147 | -536 | 165 | 550 |
| 2019 | -706 | 507 | -223 | 381 | 288 | -137 | 111 | -487 | -671 | -221 | 582 | -10 |
| 2020 | 179 | 924 | -205 | -846 | 1,060 | 243 | -1,462 | 43 | -745 | -30 | 1,095 | -679 |
| 2021 | -59 | 213 | 420 | 113 | -320 | 1,390 | -570 | -989 | -823 | 518 | -247 | -175 |
| 2022 | 980 | 934 | -673 | -83 | -608 | 470 | -175 | -1,283 | 9 | 48 | 176 | -109 |
| 2023 | 604 | -138 | 866 | -734 | 557 | 161 | -307 | -619 | -341 | 222 | 184 | 333 |
| 2024 | 562 | |||||||||||
| - = No Data Reported; -- = Not Applicable; NA = Not Available; W = Withheld to avoid disclosure of individual company data. |
| Release Date: 3/29/2024 |
| Next Release Date: 4/30/2024 |