|
Download Data (XLS File) |
|
||||||||
|
||||||||
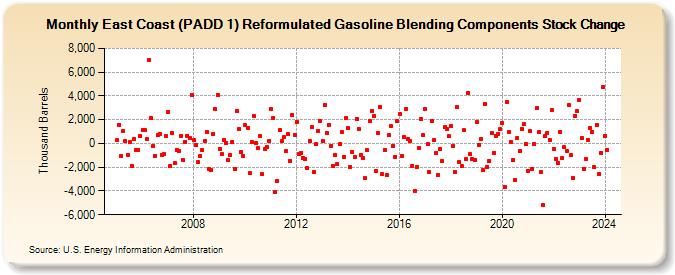
| East Coast (PADD 1) Reformulated Gasoline Blending Components Stock Change (Thousand Barrels) | ||||||||
| Year | Jan | Feb | Mar | Apr | May | Jun | Jul | Aug | Sep | Oct | Nov | Dec |
|---|---|---|---|---|---|---|---|---|---|---|---|---|
| 2005 | 259 | 1,586 | -1,022 | 1,057 | 164 | -948 | 131 | -1,862 | 350 | -573 | -519 | 624 |
| 2006 | 1,142 | 1,090 | 341 | 7,059 | 2,124 | -235 | -1,048 | 681 | 811 | -938 | -885 | 636 |
| 2007 | 2,649 | -1,884 | 916 | -1,659 | -522 | -613 | 653 | -1,412 | 159 | 647 | 422 | 4,076 |
| 2008 | 288 | -126 | -1,600 | -1,063 | -567 | 231 | 982 | -2,116 | -2,222 | 760 | 2,858 | 4,077 |
| 2009 | -442 | -893 | 311 | 58 | -1,381 | -992 | 160 | -2,164 | 2,752 | 1,202 | -701 | -1,039 |
| 2010 | 1,529 | 1,315 | -2,529 | 81 | 2,316 | 67 | -392 | 599 | -2,565 | -503 | -292 | 166 |
| 2011 | 2,896 | 2,141 | -4,094 | -3,134 | 1,117 | 173 | 515 | -661 | 762 | -1,465 | 2,396 | 699 |
| 2012 | 1,807 | -891 | -770 | -1,189 | -1,280 | -2,059 | 189 | 1,366 | -2,397 | -71 | 1,062 | 1,868 |
| 2013 | 233 | 3,252 | 885 | 1,576 | -207 | -1,863 | -970 | -1,761 | -71 | 971 | -1,139 | 2,170 |
| 2014 | 1,285 | -1,973 | -706 | -1,119 | 2,093 | 1,224 | -1,005 | -1,219 | -2,935 | -583 | 1,906 | 2,743 |
| 2015 | 2,298 | -2,339 | 857 | 3,093 | -2,600 | -566 | -2,691 | 679 | 1,467 | -216 | -1,113 | 1,888 |
| 2016 | 2,475 | -1,057 | 548 | 2,902 | 336 | 208 | -1,916 | -4,030 | -1,986 | -362 | 2,050 | 698 |
| 2017 | 2,875 | -53 | -2,425 | 1,852 | 255 | -816 | -2,637 | -467 | -1,503 | 1,344 | 1,220 | 595 |
| 2018 | 1,489 | -233 | -2,397 | 3,084 | -1,572 | -1,922 | 1,121 | -1,323 | 4,272 | -920 | -1,270 | -1,360 |
| 2019 | 1,775 | -125 | 357 | -2,274 | 3,290 | -1,992 | -1,470 | 915 | -771 | 653 | 787 | 1,186 |
| 2020 | 1,729 | -3,634 | 3,476 | 966 | 133 | -1,392 | -3,064 | 487 | -670 | 1,240 | 1,596 | -61 |
| 2021 | -2,311 | 1,023 | -2,126 | -56 | 2,957 | 934 | -2,414 | -5,221 | 628 | 915 | 308 | 2,777 |
| 2022 | -454 | -1,325 | -1,620 | 969 | -1,251 | -336 | -602 | 3,214 | -1,008 | -2,911 | 2,331 | 2,707 |
| 2023 | 1,675 | 139 | -2,122 | -1,352 | 306 | 1,322 | 1,000 | -2,012 | 1,589 | -2,602 | -798 | 4,872 |
| 2024 | 651 | -529 | -2,170 | 409 | 1,500 | -1,435 | ||||||
| - = No Data Reported; -- = Not Applicable; NA = Not Available; W = Withheld to avoid disclosure of individual company data. |
| Release Date: 8/30/2024 |
| Next Release Date: 9/30/2024 |