|
Download Data (XLS File) |
|
||||||||
|
||||||||
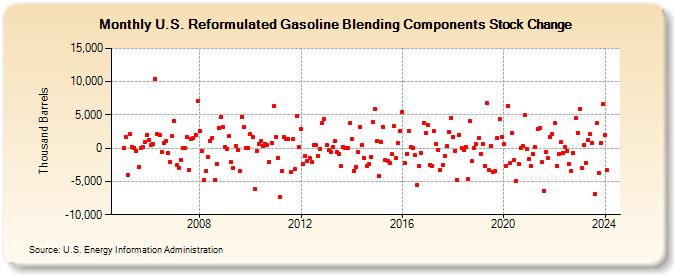
| U.S. Reformulated Gasoline Blending Components Stock Change (Thousand Barrels) | ||||||||
| Year | Jan | Feb | Mar | Apr | May | Jun | Jul | Aug | Sep | Oct | Nov | Dec |
|---|---|---|---|---|---|---|---|---|---|---|---|---|
| 2005 | 94 | 1,658 | -4,098 | 2,119 | 244 | 44 | -425 | -2,797 | -23 | 205 | 918 | 1,922 |
| 2006 | 1,245 | 546 | 649 | 10,344 | 2,156 | 2,024 | -537 | 814 | 1,043 | -771 | -2,002 | 1,764 |
| 2007 | 4,103 | -2,601 | -2,976 | -1,753 | 22 | 15 | 1,667 | -3,259 | 1,382 | 1,522 | 2,001 | 7,097 |
| 2008 | 2,560 | -482 | -4,811 | -3,376 | -1,271 | 1,054 | 1,556 | -4,762 | -2,406 | 2,980 | 4,714 | 3,158 |
| 2009 | 165 | -64 | 1,869 | -2,118 | -3,044 | 394 | -319 | -3,472 | 4,759 | 3,243 | -8 | 75 |
| 2010 | 2,098 | 1,630 | -6,115 | -462 | 579 | 1,082 | 358 | 636 | 540 | -2,009 | 844 | 6,328 |
| 2011 | 1,710 | -1,406 | -7,403 | -3,372 | 1,724 | 1,331 | 1,326 | -3,560 | 1,368 | -3,148 | 4,783 | 118 |
| 2012 | 2,883 | -2,320 | -1,170 | -1,878 | -1,545 | -2,086 | 521 | 407 | -1,129 | -90 | 3,714 | 4,383 |
| 2013 | 540 | -338 | -645 | 175 | 1,040 | -539 | -803 | -2,667 | 148 | -10 | 27 | 3,836 |
| 2014 | 1,357 | -3,374 | -2,863 | -622 | 3,158 | 550 | -1,497 | -2,729 | -2,421 | -1,263 | 3,942 | 5,878 |
| 2015 | 1,142 | -4,182 | 906 | 3,160 | -1,751 | -1,903 | -2,161 | -843 | 3,321 | -1,521 | 718 | 2,644 |
| 2016 | 5,501 | -2,302 | -803 | 2,560 | 114 | 66 | -1,029 | -5,505 | -2,610 | -726 | 3,794 | 2,226 |
| 2017 | 3,412 | -2,473 | -2,736 | 2,515 | 565 | -329 | -3,239 | -2,533 | -1,196 | 299 | 2,458 | 4,556 |
| 2018 | 1,696 | -368 | -4,779 | 2,042 | 5 | -257 | 212 | -4,573 | 4,025 | -1,965 | 38 | 578 |
| 2019 | 1,481 | -865 | 661 | -2,672 | 6,733 | -3,343 | 397 | -3,605 | -3,397 | 1,468 | 4,344 | 1,663 |
| 2020 | 580 | -2,626 | 6,339 | -2,268 | 2,298 | -1,839 | -4,910 | -2,353 | 89 | 300 | 4,970 | -102 |
| 2021 | -1,658 | -2,710 | -935 | 104 | 2,875 | 3,031 | -2,064 | -6,389 | -586 | -1,540 | 1,675 | 2,111 |
| 2022 | 3,797 | -2,632 | -916 | 873 | -729 | 200 | -479 | -2,411 | -3,414 | -680 | 4,485 | 2,322 |
| 2023 | 5,950 | -2,966 | 473 | -2,163 | 1,218 | 2,066 | 768 | -6,953 | 3,740 | -3,797 | 813 | 6,638 |
| 2024 | 1,985 | |||||||||||
| - = No Data Reported; -- = Not Applicable; NA = Not Available; W = Withheld to avoid disclosure of individual company data. |
| Release Date: 3/29/2024 |
| Next Release Date: 4/30/2024 |