|
Download Data (XLS File) |
|
||||||||
|
||||||||
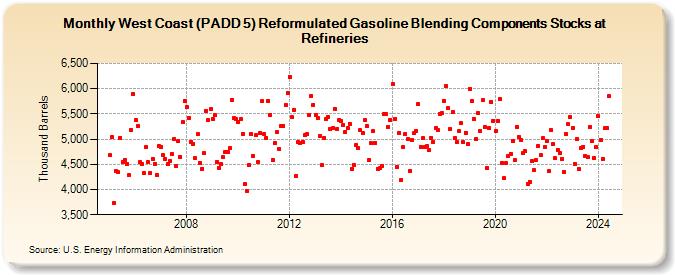
| West Coast (PADD 5) Reformulated Gasoline Blending Components Stocks at Refineries (Thousand Barrels) | ||||||||
| Year | Jan | Feb | Mar | Apr | May | Jun | Jul | Aug | Sep | Oct | Nov | Dec |
|---|---|---|---|---|---|---|---|---|---|---|---|---|
| 2005 | 4,675 | 5,039 | 3,733 | 4,366 | 4,341 | 5,022 | 4,543 | 4,589 | 4,507 | 4,278 | 5,185 | 5,891 |
| 2006 | 5,369 | 5,259 | 4,540 | 4,509 | 4,318 | 4,840 | 4,538 | 4,332 | 4,611 | 4,513 | 4,292 | 4,864 |
| 2007 | 4,847 | 4,677 | 4,612 | 4,506 | 4,562 | 4,704 | 4,993 | 4,475 | 4,955 | 4,653 | 5,332 | 5,759 |
| 2008 | 5,632 | 5,417 | 4,949 | 4,906 | 4,617 | 5,094 | 4,533 | 4,413 | 4,720 | 5,564 | 5,376 | 5,596 |
| 2009 | 5,401 | 5,471 | 4,554 | 4,431 | 4,508 | 4,635 | 4,751 | 4,751 | 4,816 | 5,785 | 5,410 | 5,390 |
| 2010 | 5,342 | 5,391 | 5,111 | 4,100 | 3,976 | 4,481 | 5,103 | 4,667 | 5,072 | 4,536 | 5,118 | 5,746 |
| 2011 | 5,101 | 5,021 | 5,762 | 5,478 | 4,587 | 4,932 | 5,138 | 4,808 | 5,260 | 5,264 | 5,673 | 5,918 |
| 2012 | 6,241 | 5,429 | 5,585 | 4,265 | 4,933 | 4,925 | 4,940 | 5,075 | 5,101 | 5,482 | 5,859 | 5,683 |
| 2013 | 5,469 | 5,411 | 5,060 | 4,481 | 5,025 | 5,401 | 5,445 | 5,200 | 5,213 | 5,598 | 5,205 | 5,383 |
| 2014 | 5,358 | 5,284 | 5,150 | 5,220 | 5,306 | 4,416 | 4,487 | 4,885 | 4,820 | 5,175 | 5,123 | 5,377 |
| 2015 | 5,254 | 4,590 | 4,918 | 5,158 | 4,924 | 4,416 | 4,432 | 4,468 | 5,494 | 5,493 | 5,248 | 5,385 |
| 2016 | 6,086 | 5,399 | 4,445 | 5,123 | 4,190 | 4,844 | 5,111 | 4,995 | 4,371 | 4,976 | 5,113 | 5,158 |
| 2017 | 5,692 | 4,853 | 5,016 | 4,845 | 4,858 | 4,782 | 5,028 | 4,940 | 5,220 | 5,171 | 5,502 | 5,508 |
| 2018 | 5,761 | 6,053 | 5,613 | 5,200 | 5,532 | 5,025 | 4,937 | 5,155 | 5,313 | 4,934 | 5,127 | 4,897 |
| 2019 | 6,001 | 5,756 | 5,399 | 5,006 | 5,510 | 5,159 | 5,770 | 5,235 | 4,431 | 5,222 | 5,744 | 5,366 |
| 2020 | 5,156 | 5,364 | 5,793 | 4,535 | 4,228 | 4,516 | 4,655 | 4,711 | 4,960 | 4,578 | 5,240 | 5,046 |
| 2021 | 4,977 | 4,719 | 4,758 | 4,118 | 4,154 | 4,561 | 4,383 | 4,585 | 4,866 | 4,675 | 5,013 | 4,842 |
| 2022 | 4,956 | 4,367 | 5,177 | 4,900 | 4,620 | 4,792 | 4,721 | 4,613 | 4,349 | 5,099 | 5,291 | 5,443 |
| 2023 | 5,218 | 4,507 | 5,005 | 4,398 | 4,831 | 4,853 | 4,667 | 4,635 | 5,242 | 4,959 | 4,625 | 4,840 |
| 2024 | 5,451 | |||||||||||
| - = No Data Reported; -- = Not Applicable; NA = Not Available; W = Withheld to avoid disclosure of individual company data. |
| Release Date: 3/29/2024 |
| Next Release Date: 4/30/2024 |