|
Download Data (XLS File) |
|
||||||||
|
||||||||
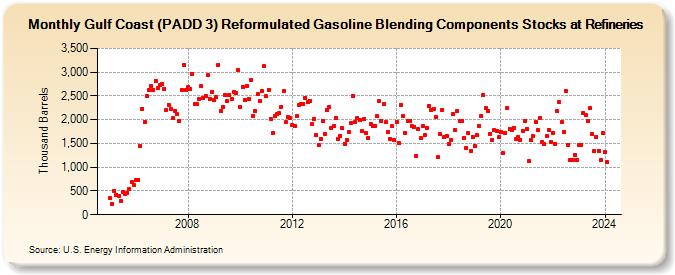
| Gulf Coast (PADD 3) Reformulated Gasoline Blending Components Stocks at Refineries (Thousand Barrels) | ||||||||
| Year | Jan | Feb | Mar | Apr | May | Jun | Jul | Aug | Sep | Oct | Nov | Dec |
|---|---|---|---|---|---|---|---|---|---|---|---|---|
| 2005 | 344 | 233 | 508 | 423 | 400 | 291 | 486 | 444 | 458 | 543 | 691 | 632 |
| 2006 | 726 | 728 | 1,446 | 2,234 | 1,954 | 2,505 | 2,631 | 2,719 | 2,632 | 2,820 | 2,662 | 2,724 |
| 2007 | 2,754 | 2,647 | 2,213 | 2,316 | 2,231 | 2,028 | 2,192 | 2,115 | 1,976 | 2,630 | 3,157 | 2,628 |
| 2008 | 2,682 | 2,647 | 2,969 | 2,325 | 2,329 | 2,431 | 2,700 | 2,452 | 2,500 | 2,930 | 2,445 | 2,580 |
| 2009 | 2,414 | 2,468 | 3,152 | 2,172 | 2,267 | 2,515 | 2,391 | 2,515 | 2,435 | 2,582 | 2,557 | 3,040 |
| 2010 | 2,272 | 2,697 | 2,423 | 2,717 | 2,443 | 2,844 | 2,086 | 2,185 | 2,535 | 2,390 | 2,604 | 3,119 |
| 2011 | 2,491 | 2,630 | 2,013 | 1,714 | 2,084 | 2,109 | 2,130 | 2,271 | 2,609 | 1,944 | 2,058 | 2,026 |
| 2012 | 1,885 | 1,872 | 2,081 | 2,306 | 2,331 | 2,336 | 2,458 | 2,363 | 2,400 | 1,899 | 2,019 | 1,681 |
| 2013 | 1,457 | 1,603 | 1,970 | 1,688 | 2,199 | 2,270 | 1,830 | 1,865 | 2,034 | 1,597 | 1,655 | 1,822 |
| 2014 | 1,495 | 1,582 | 1,739 | 1,934 | 2,496 | 1,954 | 2,030 | 2,000 | 1,766 | 2,019 | 1,718 | 1,623 |
| 2015 | 1,911 | 1,865 | 1,870 | 2,082 | 2,392 | 1,974 | 2,322 | 1,943 | 1,736 | 1,599 | 1,860 | 1,565 |
| 2016 | 1,958 | 1,503 | 2,319 | 2,085 | 1,712 | 1,981 | 1,964 | 1,866 | 1,852 | 1,243 | 1,796 | 1,607 |
| 2017 | 1,862 | 1,684 | 1,817 | 2,298 | 2,196 | 2,226 | 2,057 | 1,204 | 1,690 | 2,206 | 1,629 | 1,664 |
| 2018 | 1,486 | 1,565 | 2,128 | 1,783 | 2,184 | 1,966 | 1,979 | 1,623 | 1,412 | 1,718 | 1,348 | 1,643 |
| 2019 | 1,452 | 1,684 | 1,875 | 2,069 | 2,515 | 2,255 | 2,193 | 1,709 | 1,577 | 1,774 | 1,768 | 1,635 |
| 2020 | 1,750 | 1,299 | 1,728 | 2,236 | 1,810 | 1,777 | 1,830 | 1,583 | 1,636 | 1,579 | 1,770 | 1,981 |
| 2021 | 1,807 | 1,120 | 1,563 | 1,649 | 1,959 | 1,778 | 2,030 | 1,530 | 1,484 | 1,664 | 1,785 | 1,536 |
| 2022 | 1,726 | 1,496 | 2,172 | 2,371 | 1,945 | 1,749 | 2,605 | 1,465 | 1,141 | 1,159 | 1,262 | 1,158 |
| 2023 | 1,469 | 1,472 | 2,148 | 2,095 | 1,970 | 2,237 | 1,690 | 1,341 | 1,637 | 1,347 | 1,156 | 1,716 |
| 2024 | 1,313 | |||||||||||
| - = No Data Reported; -- = Not Applicable; NA = Not Available; W = Withheld to avoid disclosure of individual company data. |
| Release Date: 3/29/2024 |
| Next Release Date: 4/30/2024 |