|
Download Data (XLS File) |
|
||||||||
|
||||||||
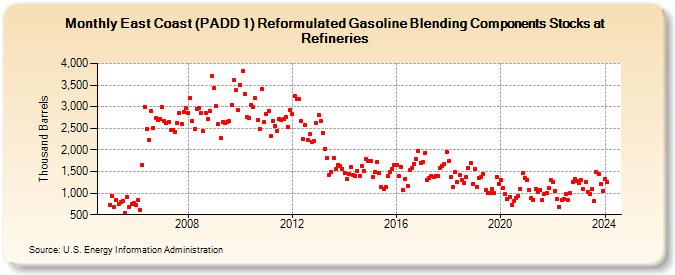
| East Coast (PADD 1) Reformulated Gasoline Blending Components Stocks at Refineries (Thousand Barrels) | ||||||||
| Year | Jan | Feb | Mar | Apr | May | Jun | Jul | Aug | Sep | Oct | Nov | Dec |
|---|---|---|---|---|---|---|---|---|---|---|---|---|
| 2005 | 731 | 932 | 672 | 849 | 747 | 786 | 820 | 547 | 916 | 686 | 741 | 772 |
| 2006 | 724 | 840 | 603 | 1,641 | 2,999 | 2,477 | 2,239 | 2,889 | 2,507 | 2,736 | 2,702 | 2,726 |
| 2007 | 2,992 | 2,670 | 2,617 | 2,649 | 2,456 | 2,456 | 2,411 | 2,628 | 2,846 | 2,610 | 2,879 | 2,969 |
| 2008 | 2,863 | 3,210 | 2,673 | 2,474 | 2,957 | 2,965 | 2,845 | 2,436 | 2,865 | 2,712 | 2,889 | 3,706 |
| 2009 | 3,432 | 3,007 | 2,595 | 2,278 | 2,651 | 2,630 | 2,648 | 2,658 | 3,046 | 3,609 | 3,377 | 2,920 |
| 2010 | 3,499 | 3,818 | 3,297 | 2,768 | 2,737 | 3,047 | 2,998 | 3,194 | 2,696 | 2,494 | 3,418 | 2,656 |
| 2011 | 2,822 | 2,900 | 2,314 | 2,674 | 2,560 | 2,447 | 2,714 | 2,683 | 2,708 | 2,755 | 2,522 | 2,929 |
| 2012 | 2,824 | 3,250 | 3,175 | 3,175 | 2,677 | 2,248 | 2,565 | 2,230 | 2,358 | 2,192 | 2,195 | 2,619 |
| 2013 | 2,808 | 2,670 | 2,388 | 2,024 | 1,815 | 1,428 | 1,496 | 1,809 | 1,550 | 1,649 | 1,626 | 1,565 |
| 2014 | 1,463 | 1,331 | 1,443 | 1,603 | 1,418 | 1,405 | 1,513 | 1,394 | 1,634 | 1,512 | 1,783 | 1,741 |
| 2015 | 1,742 | 1,379 | 1,490 | 1,719 | 1,461 | 1,147 | 1,099 | 1,137 | 1,385 | 1,477 | 1,566 | 1,641 |
| 2016 | 1,662 | 1,400 | 1,600 | 1,067 | 1,330 | 1,173 | 1,524 | 1,577 | 1,679 | 1,780 | 1,975 | 1,695 |
| 2017 | 1,718 | 1,938 | 1,312 | 1,348 | 1,396 | 1,373 | 1,404 | 1,392 | 1,581 | 1,623 | 1,666 | 1,954 |
| 2018 | 1,754 | 1,368 | 1,149 | 1,488 | 1,264 | 1,409 | 1,304 | 1,241 | 1,372 | 1,583 | 1,695 | 1,210 |
| 2019 | 1,568 | 1,146 | 1,346 | 1,384 | 1,446 | 1,075 | 1,011 | 1,000 | 1,097 | 995 | 1,381 | 1,216 |
| 2020 | 1,304 | 1,107 | 978 | 860 | 906 | 732 | 827 | 892 | 933 | 1,105 | 1,461 | 1,356 |
| 2021 | 1,311 | 1,073 | 890 | 848 | 1,097 | 1,016 | 1,064 | 850 | 981 | 1,001 | 1,115 | 1,304 |
| 2022 | 1,265 | 1,060 | 858 | 680 | 845 | 864 | 976 | 830 | 1,003 | 1,252 | 1,335 | 1,281 |
| 2023 | 1,232 | 1,312 | 1,090 | 1,262 | 1,017 | 976 | 1,092 | 809 | 1,496 | 1,447 | 1,208 | 1,045 |
| 2024 | 1,315 | |||||||||||
| - = No Data Reported; -- = Not Applicable; NA = Not Available; W = Withheld to avoid disclosure of individual company data. |
| Release Date: 3/29/2024 |
| Next Release Date: 4/30/2024 |