|
Download Data (XLS File) |
|
||||||||
|
||||||||
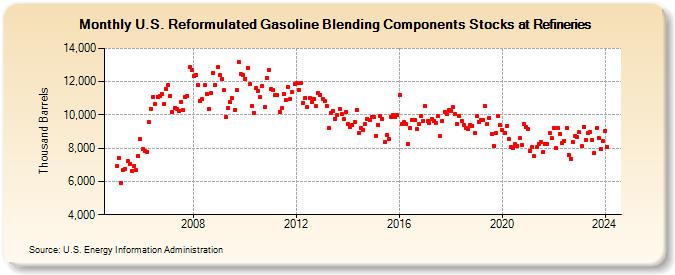
| U.S. Reformulated Gasoline Blending Components Stocks at Refineries (Thousand Barrels) | ||||||||
| Year | Jan | Feb | Mar | Apr | May | Jun | Jul | Aug | Sep | Oct | Nov | Dec |
|---|---|---|---|---|---|---|---|---|---|---|---|---|
| 2005 | 6,902 | 7,427 | 5,930 | 6,700 | 6,770 | 7,200 | 7,048 | 6,658 | 6,944 | 6,675 | 7,551 | 8,563 |
| 2006 | 7,925 | 7,845 | 7,766 | 9,550 | 10,384 | 11,095 | 10,661 | 11,096 | 11,155 | 11,279 | 10,673 | 11,549 |
| 2007 | 11,807 | 11,156 | 10,190 | 10,416 | 10,385 | 10,216 | 10,777 | 10,271 | 11,063 | 11,154 | 12,872 | 12,716 |
| 2008 | 12,347 | 12,377 | 11,775 | 10,833 | 10,929 | 11,778 | 11,270 | 10,342 | 11,302 | 12,515 | 11,808 | 12,876 |
| 2009 | 12,401 | 12,148 | 11,495 | 9,874 | 10,429 | 10,758 | 11,011 | 10,313 | 11,475 | 13,172 | 12,440 | 12,407 |
| 2010 | 12,169 | 12,851 | 11,844 | 10,527 | 10,140 | 11,612 | 11,434 | 11,067 | 11,734 | 10,448 | 12,234 | 12,673 |
| 2011 | 11,557 | 11,475 | 11,192 | 11,206 | 10,190 | 10,397 | 11,261 | 10,897 | 11,690 | 10,972 | 11,352 | 11,864 |
| 2012 | 11,920 | 11,514 | 11,931 | 10,739 | 11,041 | 10,469 | 11,038 | 10,752 | 10,960 | 10,514 | 11,307 | 11,226 |
| 2013 | 10,945 | 10,834 | 10,557 | 9,205 | 10,131 | 10,214 | 9,783 | 10,001 | 10,359 | 10,070 | 9,750 | 10,192 |
| 2014 | 9,428 | 9,263 | 9,413 | 9,591 | 10,321 | 8,922 | 9,236 | 9,112 | 9,431 | 9,760 | 9,666 | 9,864 |
| 2015 | 9,885 | 8,736 | 9,412 | 9,928 | 9,767 | 8,351 | 8,816 | 8,538 | 9,862 | 10,023 | 9,875 | 9,976 |
| 2016 | 11,204 | 9,429 | 9,550 | 9,441 | 8,261 | 9,212 | 9,717 | 9,707 | 9,156 | 9,425 | 9,912 | 9,660 |
| 2017 | 10,512 | 9,616 | 9,528 | 9,746 | 9,630 | 9,526 | 9,931 | 8,715 | 9,615 | 10,182 | 10,053 | 10,297 |
| 2018 | 10,237 | 10,459 | 10,058 | 9,464 | 9,918 | 9,660 | 9,371 | 9,188 | 9,165 | 9,422 | 9,339 | 8,892 |
| 2019 | 9,925 | 9,590 | 9,678 | 9,693 | 10,511 | 9,470 | 9,841 | 8,846 | 8,135 | 8,933 | 9,906 | 9,395 |
| 2020 | 9,107 | 8,888 | 9,320 | 8,560 | 8,082 | 7,999 | 8,234 | 8,103 | 8,608 | 8,180 | 9,451 | 9,296 |
| 2021 | 9,137 | 7,839 | 8,070 | 7,509 | 8,048 | 8,276 | 8,394 | 7,791 | 8,255 | 8,278 | 8,888 | 8,601 |
| 2022 | 9,240 | 8,005 | 9,195 | 8,842 | 8,292 | 8,462 | 9,206 | 7,618 | 7,356 | 8,398 | 8,713 | 8,659 |
| 2023 | 8,949 | 8,104 | 9,264 | 8,512 | 8,900 | 8,947 | 8,466 | 7,700 | 9,192 | 8,601 | 7,975 | 8,414 |
| 2024 | 9,042 | |||||||||||
| - = No Data Reported; -- = Not Applicable; NA = Not Available; W = Withheld to avoid disclosure of individual company data. |
| Release Date: 3/29/2024 |
| Next Release Date: 4/30/2024 |