|
Download Data (XLS File) |
|
||||||||
|
||||||||
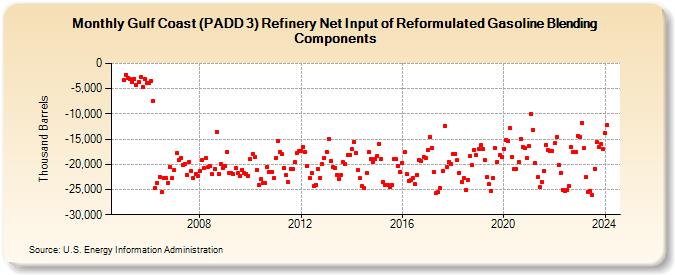
| Gulf Coast (PADD 3) Refinery Net Input of Reformulated Gasoline Blending Components (Thousand Barrels) | ||||||||
| Year | Jan | Feb | Mar | Apr | May | Jun | Jul | Aug | Sep | Oct | Nov | Dec |
|---|---|---|---|---|---|---|---|---|---|---|---|---|
| 2005 | -3,283 | -2,186 | -2,785 | -3,171 | -3,704 | -3,127 | -4,340 | -3,744 | -2,759 | -4,683 | -3,033 | -3,853 |
| 2006 | -3,798 | -3,405 | -7,506 | -24,700 | -23,628 | -22,433 | -25,550 | -22,715 | -22,738 | -23,692 | -20,626 | -22,779 |
| 2007 | -21,093 | -17,782 | -19,216 | -18,697 | -20,115 | -19,847 | -22,159 | -19,519 | -21,249 | -22,706 | -21,925 | -22,383 |
| 2008 | -21,396 | -19,101 | -20,825 | -18,837 | -20,481 | -20,360 | -21,995 | -20,953 | -13,528 | -21,944 | -19,965 | -20,776 |
| 2009 | -20,250 | -17,561 | -21,676 | -21,772 | -21,979 | -20,803 | -21,823 | -22,380 | -21,090 | -21,705 | -21,959 | -22,296 |
| 2010 | -18,988 | -17,929 | -18,609 | -21,083 | -24,115 | -23,010 | -23,772 | -23,616 | -20,553 | -21,584 | -21,514 | -22,748 |
| 2011 | -18,765 | -15,336 | -17,533 | -18,052 | -20,707 | -22,202 | -23,547 | -20,851 | -20,958 | -19,544 | -17,730 | -17,311 |
| 2012 | -17,301 | -16,560 | -17,655 | -20,259 | -22,732 | -21,719 | -24,306 | -24,023 | -20,908 | -22,664 | -19,973 | -18,738 |
| 2013 | -17,546 | -14,965 | -19,332 | -20,539 | -20,662 | -22,057 | -22,875 | -22,046 | -19,631 | -20,030 | -18,155 | -18,096 |
| 2014 | -17,046 | -15,516 | -17,856 | -21,151 | -22,781 | -24,259 | -24,714 | -21,748 | -17,561 | -18,964 | -19,540 | -18,972 |
| 2015 | -18,315 | -15,987 | -18,960 | -23,504 | -24,095 | -24,163 | -24,476 | -24,028 | -18,912 | -19,017 | -20,284 | -21,519 |
| 2016 | -19,739 | -17,632 | -21,985 | -23,340 | -23,110 | -22,711 | -24,002 | -22,050 | -19,062 | -19,429 | -18,547 | -18,662 |
| 2017 | -17,083 | -14,527 | -16,708 | -21,541 | -25,616 | -25,566 | -24,775 | -21,358 | -12,393 | -20,539 | -19,511 | -19,963 |
| 2018 | -17,973 | -17,899 | -19,217 | -21,665 | -23,528 | -22,709 | -25,020 | -23,043 | -18,449 | -20,231 | -17,109 | -18,195 |
| 2019 | -16,942 | -16,257 | -16,871 | -19,090 | -22,578 | -24,004 | -25,334 | -22,753 | -16,778 | -19,534 | -18,176 | -18,477 |
| 2020 | -16,971 | -15,094 | -15,379 | -12,859 | -18,614 | -20,983 | -20,975 | -19,510 | -14,944 | -16,529 | -16,843 | -18,728 |
| 2021 | -16,468 | -10,015 | -13,181 | -19,798 | -22,606 | -24,560 | -23,498 | -21,334 | -16,103 | -17,188 | -17,429 | -17,348 |
| 2022 | -15,873 | -14,547 | -20,041 | -21,671 | -25,039 | -25,223 | -25,017 | -24,304 | -16,637 | -17,651 | -17,611 | -14,326 |
| 2023 | -14,609 | -11,710 | -16,808 | -22,495 | -25,556 | -25,342 | -26,178 | -20,856 | -15,613 | -16,648 | -16,000 | -17,030 |
| 2024 | -13,883 | |||||||||||
| - = No Data Reported; -- = Not Applicable; NA = Not Available; W = Withheld to avoid disclosure of individual company data. |
| Release Date: 3/29/2024 |
| Next Release Date: 4/30/2024 |